Closer and closer to the focus Observing undersea earthquakes where they occur

To properly understand earthquakes, we need to gather observational data from near their source. Working to that end over many years, the Earthquake Research Institute at the University of Tokyo has developed a system capable of monitoring the earthquakes that occur frequently under the sea. This system also played a role in understanding the 2011 Tohoku earthquake, but even as the accuracy of observations has increased, we are learning that the mechanisms underlying seismic events are more complex than they seem.
Measurements reveal the moment of the tsunami caused by the 2011 Tohoku earthquake
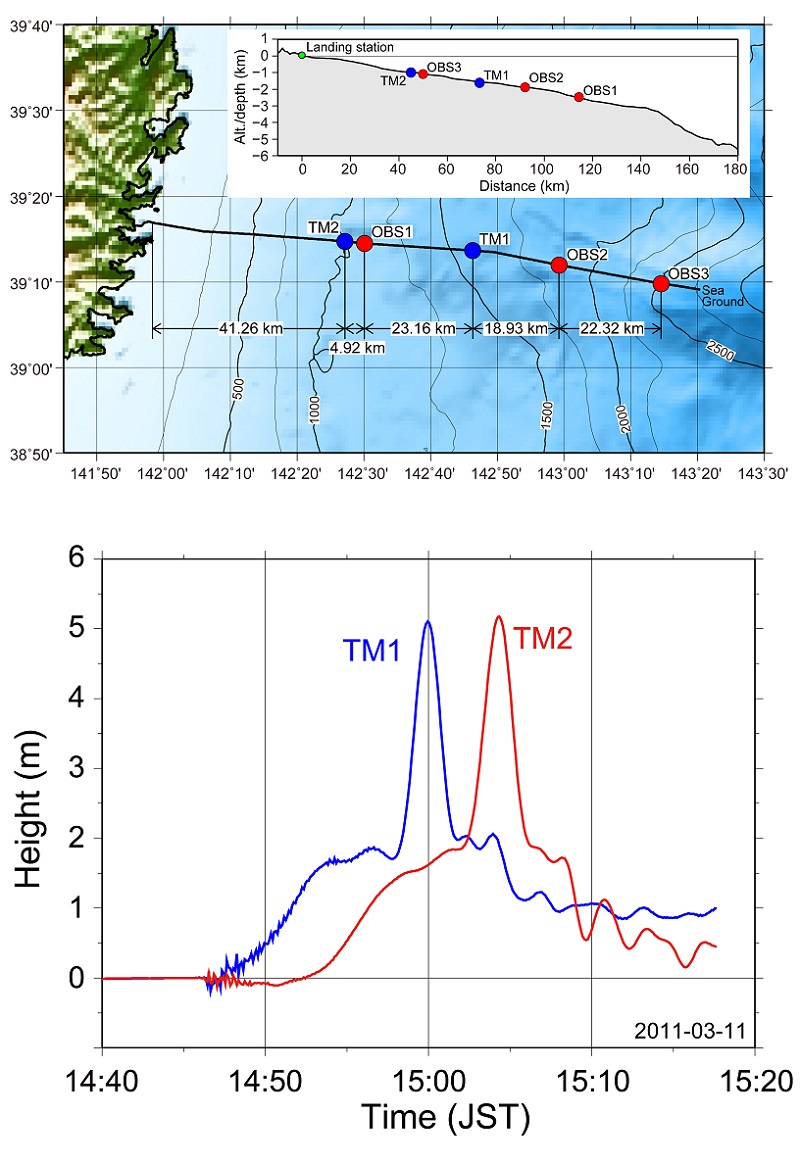
Figure 1:The ocean-bottom seismic and tsunami observation system that was deployed off the Sanriku coast at the time of the 2011 Tohoku earthquake, and tsunami height data recorded at the time
Upper panel. Three seismometers (OBS1 to 3) and two tsunami meters (TM1 and TM2) connected by optical fiber cable of total length 120 km deployed off the Sanriku coast in 1996 for scientific research by the Earthquake Research Institute. Lower panel. Data representing tsunami height, characterized by changes in water pressure captured by the tsunami meters immediately after the onset of the Tohoku earthquake. We can see that the tsunami developed in two stages. The landing station, which retrieves the cable from the ocean to land, was damaged by the tsunami, bringing observations to a halt.
© 2016 Earthquake Research Institute, The University of Tokyo.
The moment of the seismic event in the Pacific Ocean off the coast of Japan’s Tohoku region on March 11, 2011, that gave rise to the unprecedented catastrophe that was the Great East Japan Earthquake and tsunami, was captured by the Earthquake Research Institute’s ocean-bottom seismic monitoring system, comprising three seismometers and two tsunami meters.
The levels displayed by the two tsunami meters started to increase immediately after the earthquake. Fifteen minutes later, tsunami meter TM1, located about 65 km offshore, and three to four minutes after that, tsunami meter TM2, about 20 km closer to land, showed changes in water pressure corresponding to a tsunami height of about 5 meters (Figure 1). Professor Masanao Shinohara of the Center for Geophysical Observation and Instrumentation at the Earthquake Research Institute, was astonished when he saw the tsunami data, “We’d never seen such a height before.” The height of a tsunami can usually be expressed in centimeters, but in this case, it was meters high, hundreds of times the normal level
But the data revealed even more information. “It had been thought that tsunami mainly form above the source area of an earthquake, but in the case of the 2011 Tohoku earthquake, the seafloor moved substantially in the vicinity of the ocean trench into which the oceanic plate subsides, triggering a large tsunami,” Shinohara explains.
Why is ocean-bottom monitoring important?
By 2015, Japan, one of the world’s most earthquake-prone countries, already had highly-sensitive earthquake monitoring sites deployed at about 1,800 locations on land. However, nearly all major earthquakes occurring in Japan are generated under the seabed (Figure 2).
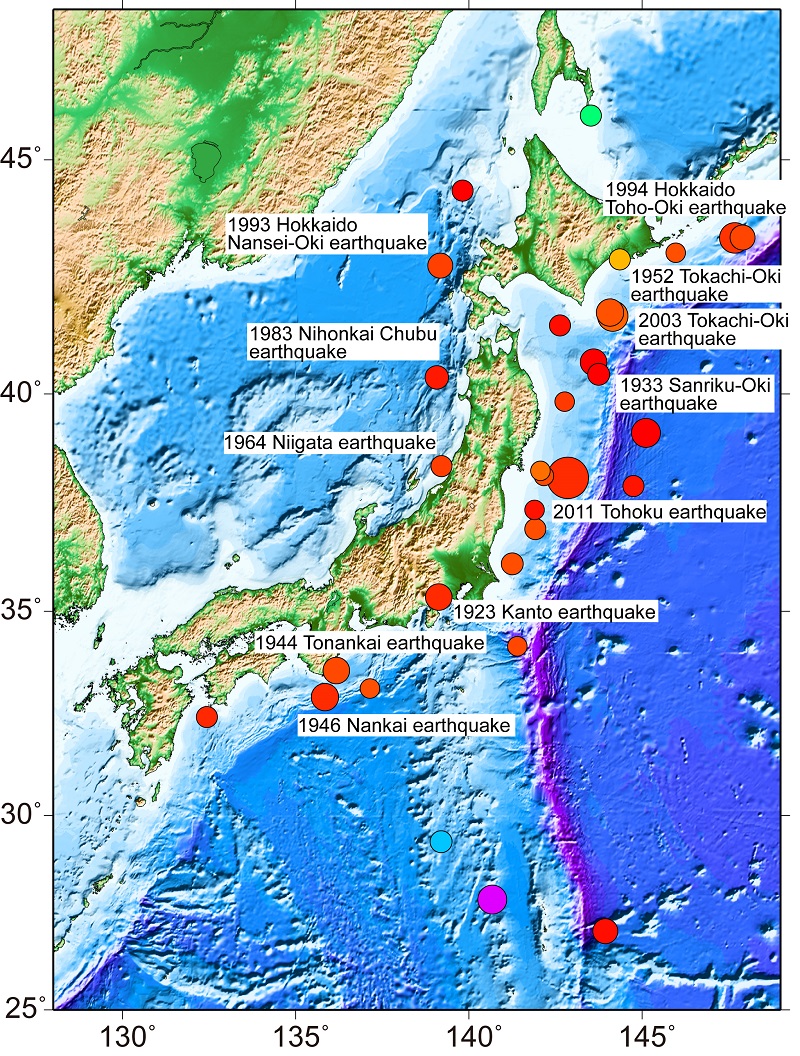
Figure 2:Major earthquakes of magnitude 7.4 or greater since 1923
All the earthquakes of magnitude 7.4 or greater since the 1923 Great Kanto earthquake, including the 1964 Niigata earthquake, the 1983 Nihonkai-Chubu earthquake, the 1994 Hokkaido-Nansei-Oki earthquake, and the 2003 Tokachi-Oki earthquake, occurred under the sea floor.
© 2016 Earthquake Research Institute, The University of Tokyo.
Professor Shinohara explains the importance of ocean-bottom seismometers thus: “To properly understand seismic events, we need to obtain observational data from as close as possible to their source.” However, many challenges confront researchers when they attempt to make ocean-bottom observations, simply because of the location at the bottom of the sea, including electrical power constraints, the need to counter the effects of high pressures and corrosion, the fact that electromagnetic waves (light) cannot reach the ocean bottom, and because humans cannot directly operate the equipment. The history of the development of seismometers in Japan has involved overcoming each of these challenges in turn.
The ocean-bottom seismometers developed by Shinohara and his team are of two types, pop-up and cabled. Developing these seismometers has required advances in marine engineering, communications, materials science, and other associated technologies, and while they are now on a par with their land-based counterparts in their ability to acquire highly accurate observational data, it wasn’t always so, particularly when the technologies were in their infancy. Shinohara recalls, “My predecessors started out making nearly everything by hand, including seismometer sensors, tape recorders for data recording, and pressure-resistant containers.”
The pop-up seismometer has evolved through successive improvements
The development of seismometers by the Earthquake Research Institute began about 58 years ago. Work also started at the same time in the University’s Faculty of Science, and ocean-bottom seismic observations moved into full swing about ten years later. The ocean-bottom seismometers developed by each group were rope-moored types, in which an ocean-bottom seismometer attached to a ballast weight and rope was dropped to the seabed. Observations would be carried out for a fixed time, and then the seismometer would be recovered via a marker buoy floating on the surface. However, on top of the massive effort required to pull up several kilometers of rope, there was no shortage of problems encountered in retrieving these seismometers, such as the buoy being swept away with the consequent loss of the seismometer and its precious data.

Figure 3:The current model of pop-up ocean-bottom seismometer
Upper panel. The diameter of the pressure-resistant sphere is about 50 cm. A ballast weight is fitted to the bottom of the sphere to make it sink. At the start of development, data was collected by analog recordings, but from the 1990s, digital recording techniques took over. Lower panel. The process from deployment to retrieval of an ocean-bottom seismometer. The seismometer is dropped from a ship on the surface, and begins its observations when it reaches the seabed. After the observations are complete, the ship returns to the location where it deployed the seismometer and emits an acoustic signal. The signal triggers the mechanism which releases the seismometer from the ballast, and it pops up to the surface.
© 2016 Earthquake Research Institute, The University of Tokyo.
Therefore, a group from the Earthquake Research Institute headed by Dr. Shozaburo Nagumo and Junzo Kasahara, and a group from the Geophysical Laboratory in the Faculty of Science headed by Dr. Toshi Asada, Dr. Hideki Shimamura and Dr. Toshihiko Kanazawa independently developed pop-up-type devices at the beginning of the 1980s. The pop-up ocean-bottom seismometer they developed was released from its ballast weight at a time predetermined by a clock timer mechanism, allowing it to float to the surface. The instrument was contained in a pressure-resistant glass sphere, and could record about one month’s worth of observational data. However, there were cases where the seismometer was lost when the clock timer operated during a typhoon, even though the device made it to the surface. To address this shortcoming, a release mechanism activated by acoustic command was added, in which the seismometer itself severs the connection to the ballast weight and floats to the surface after receiving an acoustic signal from a vessel above, allowing it to be reliably retrieved without being influenced by weather concerns.
At around about the turn of the 21st century, when Kanazawa and his colleagues were lengthening and broadening the scope of their earthquake observations at the Earthquake Research Institute, Shinohara became involved in a number of significant developments, one of which was the titanium alloy sphere, with its superior corrosion resistance (Figure 3). The number of batteries that could be installed was also increased, enabling a whole year’s worth of continuous observations to be made. Other instruments with specific functions were added, including high-precision tsunami meters, which identify tsunamis and ocean-bottom movements from the pressure of the seawater, and accelerometers that were capable of registering major seismic events without saturation.
Pop-up seismometers that facilitate low-cost observation campaigns at multiple locations are suited to cooperative research with overseas partners, and have been used in New Zealand and Chile, countries which also experience major damage due to earthquakes.
Cabled seismometers permit observations to be made in real time
A cabled ocean-bottom seismometer system makes extensive use of telecommunications technology, and consists of a chain of seismometers located at regular intervals, replacing the repeaters in a submarine communications cable. The Japan Meteorological Agency deployed the first generation of this technology in Japan, using analog transmission through copper wires, in a cabled system located off the coast of Omaezaki. The second-generation technology, using digital transmission via optical fiber, was installed in the ocean-bottom earthquake observation system deployed off the coast of the Izu Peninsula by the Earthquake Research Institute in 1993.

Figure 4:Cabled ocean-bottom seismic observation system
Upper panel: Cabled ocean-bottom seismometers installed off Awashima in 2010.
Lower panel: The end of the cable is connected to land, power is supplied from a land-based generator, and data is transmitted to the land-based data center.
© 2016 Earthquake Research Institute, The University of Tokyo.
Shinohara explains the advantages of cabled seismometer systems thus: “While we can’t acquire the data from a pop-up seismometer until the instrument is retrieved, cabled seismometers can transmit data in real time, making it possible to monitor events that are occurring at any given moment.”
The third-generation systems currently being developed at the Earthquake Research Institute are more compact and energy-efficient, and are engineered so that they can be scaled up after deployment (figure 4). Their major advantage is that data is transmitted via the Internet and individual micro-computer-equipped seismometers can communicate with one another. One system with a total length of 25 km was deployed off the coast of Awashima Island in Niigata Prefecture in 2010, followed by another with total length 105 km off the Sanriku coast in 2015. “Three observation stations are installed in the cable. As the one farthest from land is equipped with an expansion port in addition to the seismometer, and has a connector that can be manipulated in situ, we can use an underwater robot to add new sensors or replace old ones, even after the system is in place,” Shinohara says.
Discovery of a phenomenon that occurs at shallow plate boundaries
It is believed that the degree of “coupling” between plates, the extent to which they are locked together, is a determinant of any resulting seismic event. The simplest explanation is that plates with weak coupling slip past each other continuously, in contrast to those with strong coupling that do not. Over time, the stress builds up between strongly-coupled plates, and when that stress can no longer be resisted, the coupling is overcome and an earthquake occurs.
Plate boundary earthquakes were previously thought to arise from plate boundaries at greater depths, rather than from those at shallower depths, at which the coupling is weaker. However, the data acquired for the 2011 Tohoku earthquake showed that a shallow plate boundary slipped substantially at the time of the event.
Recognizing the need for greater understanding of shallow plate boundaries, Shinohara and his colleagues, in a joint research effort with Kyushu University and others, deployed an array of 12 ocean-bottom seismometers in the Hyuga-Nada sea off the east coast of the island of Kyushu in 2013. Observations over a three-month period revealed a focus (the origin or hypocenter of an earthquake) generating slight vibrations known as a low-frequency seismic tremor at a shallow plate boundary. Further analysis of this data showed that the focus of this low-frequency seismic tremor was moving. This indicated that a slow slip event, a phenomenon in which plates slip past each other on a continuing basis, had possibly taken place.
In 2015, ocean-bottom seismometers were deployed for a further year’s observations in the Hyuga-Nada sea, and retrieved at the beginning of January 2016. What kinds of phenomena will have been recorded by these seismometers? Looking back on the situation five years ago, Shinohara says “The event made us realize that we understood only a part of the process of oceanic plate subduction." Expectations are high that this data may allow us to further our understanding of events that occur on the seabed.
Interview/text: Bifue Ushijima
Translation: Tony Atkinson
Researcher
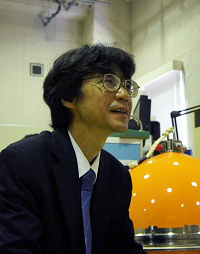
Professor Masanao Shinohara


