Title
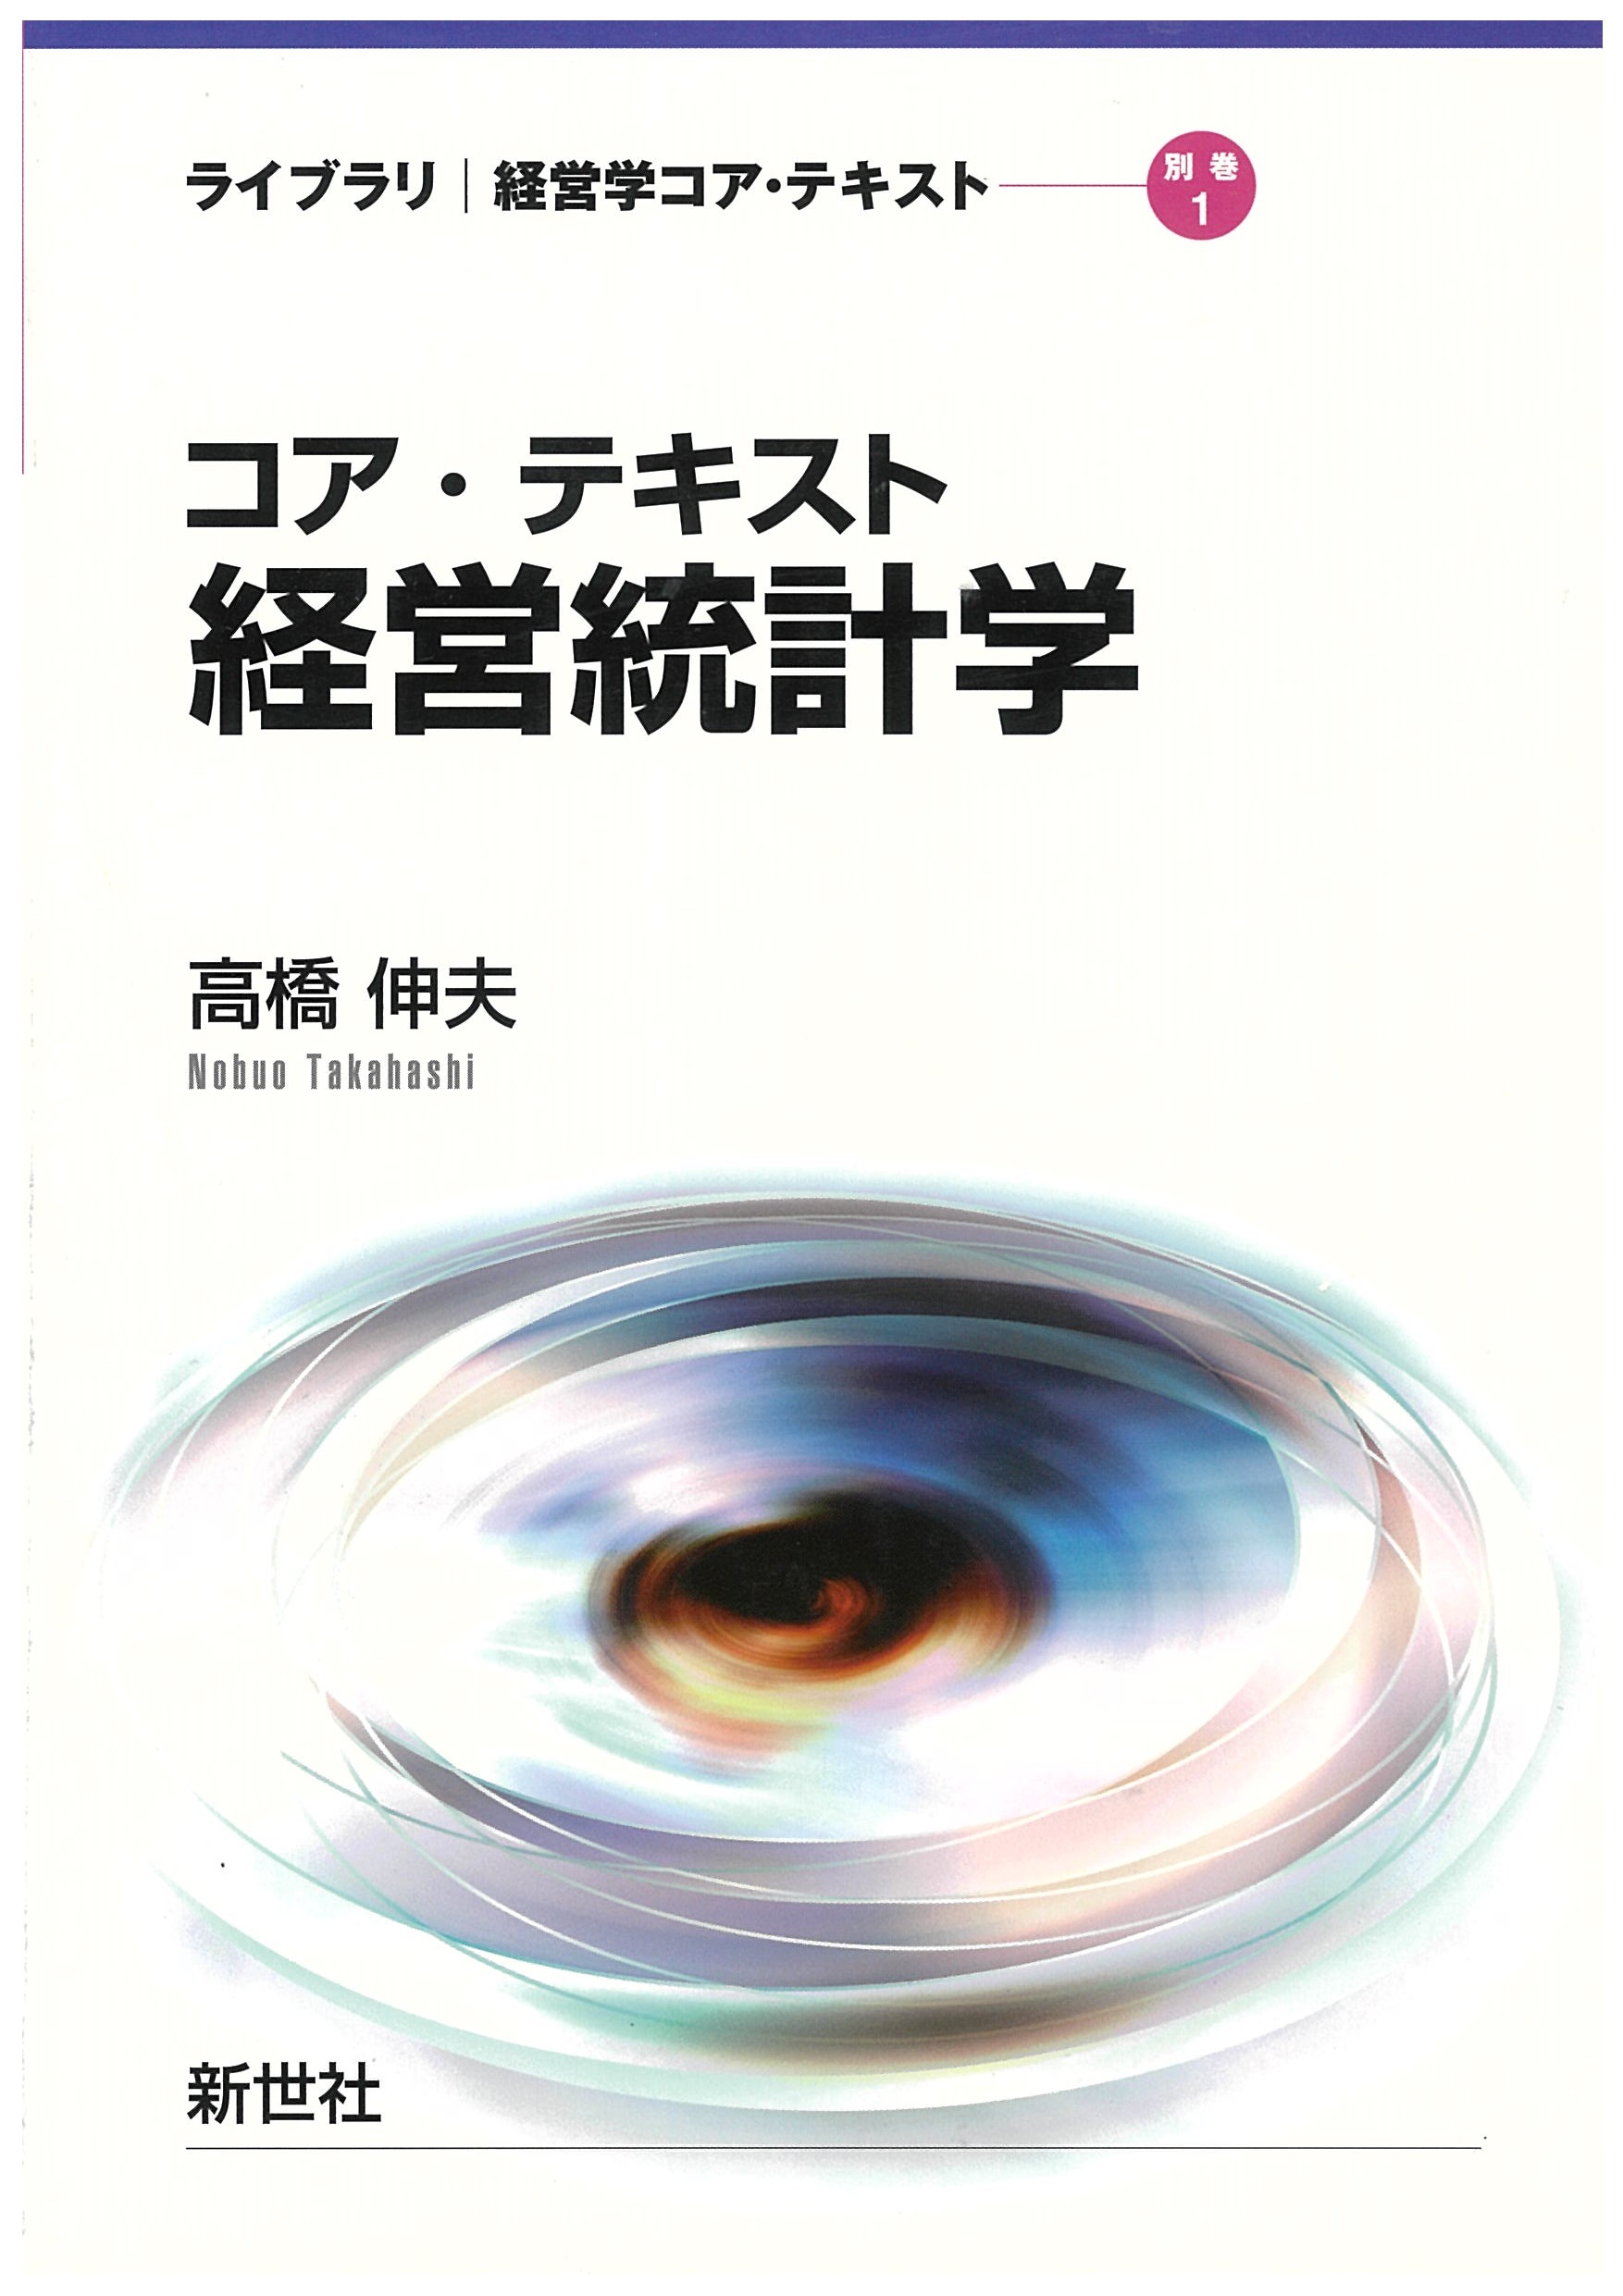
Core Text: Keiei Toukeigaku (Library: Business Administration Core Text Supplementary Volume 1 - Core Text: Management Statistics)
Size
208 pages, A5 format
Language
Japanese
Released
ISBN
978-4-88384-224-7
Published by
Shinsei-Sha Co., Ltd.
Book Info
See Book Availability at Library
Japanese Page
Many statistics textbooks are available today, though very few offer simple explanations for statistical methods that are useful in business administration. For example, even though textbooks may touch on testing the difference between two means, the correlation coefficients of cross-tables and its test, and elaborations, they do so only briefly, unlike this book, which explains these topics in detail. And most students will be overwhelmed at the mathematical statistics formulas in typical textbooks and will not be able to keep up with them.
Thus, many students are not only unable to properly understand the business journal papers that analyze survey data but also unable to understand the methodologies employed when they write their graduation or masters theses, and they instead rely on statistical software and use the output of that software in their papers. Moreover, many instances in the field of business administration require gathering data by oneself through actual surveys and for the most part there are no statistics textbooks that provide knowledge on social survey methods that are required to do so.
In actuality, when I was a graduate student I was asked to administer a questionnaire survey to some companies, and I had no idea how to analyze data. At that time, I headed to the research lab of a statistics teacher who had helped me in a seminar that involved reading a very difficult mathematical statistics textbook in English. He recommended me some “basic” textbooks. However, I was dismayed that I had read all of them before. It seems that mathematical statisticians are not very interested in the practical application of statistics.
I was very embarrassed at that time; I asked for help from several friends who were earning a living through the development of mainframe computer software and statistical processing of surveys. I learned how to use both SPSS and SAS statistical software packages and randomly read the software manuals. For the first time, I understood how to use cross-table tests (Chapter 5 in this book) and cross-table coefficients (Chapter 7). These were very commonly used statistical tools in the world of survey professionals, even though no statistics textbooks covered them. Similarly, testing the difference between two means (Chapter 4) has been of tremendous benefit to me, but this has been given only scant attention, if at all, in statistics textbooks. Thus, I began my journey of gathering knowledge about useful statistical tools.
Explaining the fundamentals of statistics using various examples and questions, this book focuses on common statistical methods and sociological survey methods used in business. It is devised to allow its readers to feel what it is like to handle statistical data. In addition, the book allows readers to quickly understand and use statistical methodologies, including Excel required to analyze actual quantitative surveys, rather than advanced statistical software packages that are often nothing more than a black box.
(Written by TAKAHASHI Nobuo, Professor, Graduate School of Economics / 2017)


 Find a book


