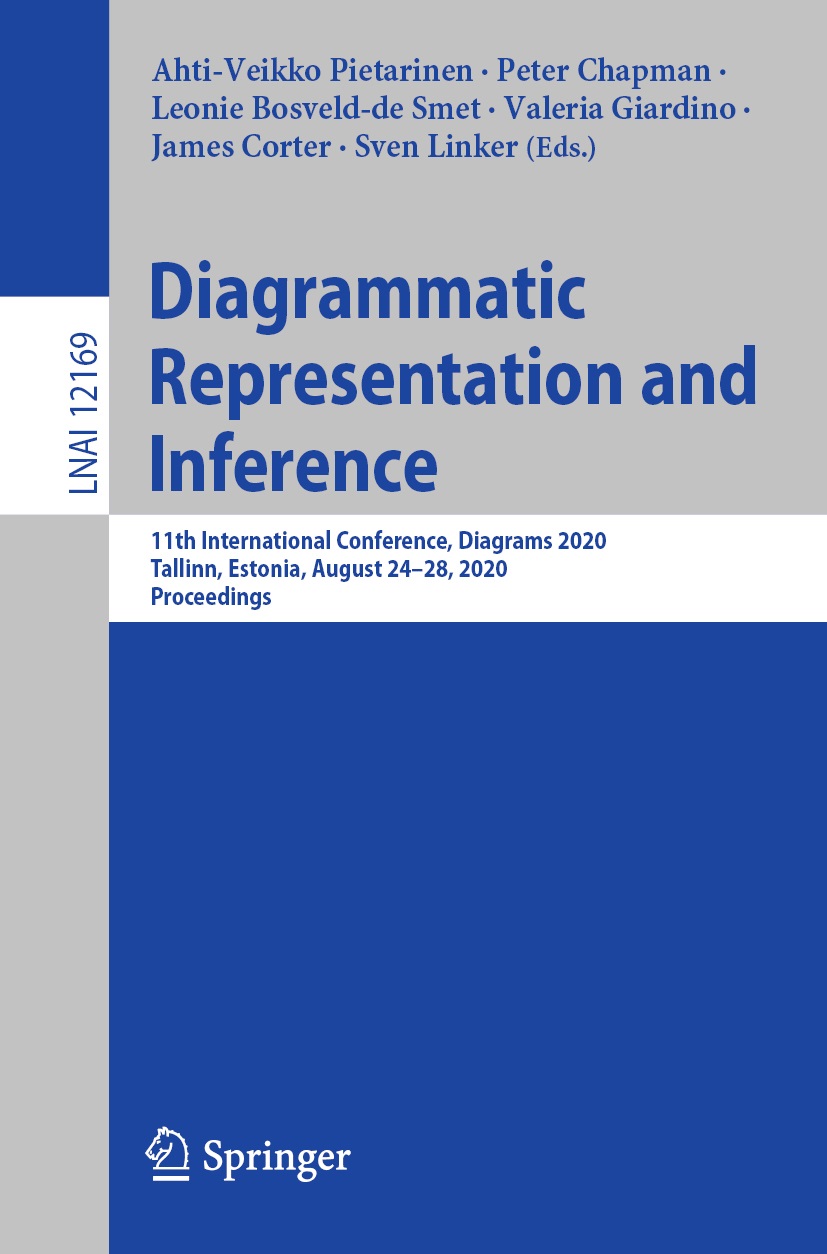
Title
Lecture Notes in Artificial Intelligence, Subseries of Lecture Notes in Computer Science Diagrammatic Representation and Inference 9th International Conference, Diagrams 2016, Philadelphia, PA, USA, August 7-10, 2016 Proceedings
Size
299 pages, softcover
Language
English
Released
2016
ISBN
978-3-319-42332-6
Published by
Springer
Book Info
See Book Availability at Library
Japanese Page
This book focuses on “diagrams” and includes academic research papers done in various areas, such as psychology, education, philosophy, engineering, and cognitive science. The importance of diagrams is widely known. For example, the “key competencies” which were proposed by the OECD also included the ability of people using external resources such as diagrams.
The book was published when the 9th International Conference on the Theory and Application of Diagrams (Diagrams 2016) was held in Philadelphia in the US. This conference is held once every two years. The book was published as the proceedings of this conference and all papers included in this book were peer reviewed. The acceptance rate of full research papers in this book was around 30%, so that it can be said that the quality of papers in the book is similar to that of peer-reviewed papers published in high-ranking international journals. All the papers have been indexed in the SCOPUS database.
The papers in this book have been organized into sections such as “cognitive aspects of diagrams”, “logic and diagrams”, “diagrams and education”, “design principle for diagrams”, and “diagrams layout”. The research in “cognitive aspects of diagrams” mainly examined the mechanism of why people can get the sense that we can understand more easily when a diagram is given compared to when verbal information only is provided. The research in “diagrams and education” includes studies promoting the effective use of diagrams. For example, Manalo and Uesaka (2016) empirically demonstrated how to promote university students’ spontaneous use of diagrams in written communication. Uesaka, Igarashi, and Suetsugu (2016) emphasized the importance of the ability to find a solution for controversial issues, which is called “multi-perspective integration”, and they demonstrated that diagram use (which here meant the use of tables) works effectively to enable this integration. In “design principles for diagrams” and “diagrams layout”, the principles for creating effective diagrams and concrete examples of effective diagrams were examined.
(Written by UESAKA Yuri, Associate Professor, Center for Research and Development on Transition from Secondary to Higher Education / 2021)
Table of Contents
Diagrams Affect Choice of Strategy in Probability Problem Solving
Xing, Chenmu (et al.)
What Constitutes an Effective Representation?
Cheng, Peter C-H.
Measuring User Comprehension of Inference Rules in Euler Diagrams
Linker, Sven (et al.)
Exploring Representations of Student Time-Use
Fox, Amy Rae (et al.)
Logic and Diagrams
Evaluating Diagrammatic Patterns for Ontology Engineering
Alharbi, Eisa (et al.)
The Interaction Between Logic and Geometry in Aristotelian Diagrams
Demey, Lorenz (et al.)
A Generic Approach to Diagrammatic Representation: The Case of Single Feature Indicator Systems
Shimojima, Atsushi (et al.)
A Logical Investigation of Heterogeneous Reasoning with Graphs in Elementary Economics
Takemura, Ryo
Euler and Venn Diagrams
Minimizing Clutter Using Absence in Venn-ieie
Burton, Jim (et al.)
Human Reasoning with Proportional Quantifiers and Its Support by Diagrams
Sato, Yuri (et al.)
Extensions of Euler Diagrams in Peirce’s Four Manuscripts on Logical Graphs
Pietarinen, Ahti-Veikko
Diagrams and Education
Hint, Instruction, and Practice: The Necessary Components for Promoting Spontaneous Diagram Use in Students’ Written Work?
Manalo, Emmanuel (et al.)
Promoting Multi-perspective Integration as a 21st Century Skill: The Effects of Instructional Methods Encouraging Students’ Spontaneous Use of Tables for Organizing Information
Uesaka, Yuri (et al.)
Using Diagrammatic Drawings to Understand Fictional Spaces: Exploring the Buendía House in Gabriel García Márquez’s One Hundred Years of Solitude
Pérez-Kriz, Sarah (et al.)
Design Principles for Diagrams
An Investigation into OWL for Concrete Syntax Specification Using UML Notations
Thomas, Anitta (et al.)
Using One-Dimensional Compaction for Smaller Graph Drawings
Rüegg, Ulf (et al.)
On Comments in Visual Languages
Schulze, Christoph Daniel (et al.)
Bistable Perception and Fractal Reasoning
McGreggor, Keith (et al.)
Diagrams Layout
Who, Where, When and with Whom? Evaluation of Group Meeting Visualizations
Kriglstein, Simone (et al.)
The Perception of Clutter in Linear Diagrams
Alqadah, Mohanad (et al.)
People, Place, and Time: Inferences from Diagrams
Tversky, Barbara (et al.)
Exploring the Types of Messages that Pie Charts Convey in Popular Media
Burns, Richard (et al.)
Comparison of Diagrams in Producing and Understanding Hierarchies in Three Different Application Domains
Bosveld-de Smet, Leonie (et al.)
Posters
Evaluating the Effects of Colour in LineSets
Tranquille, Dominique (et al.)
Negative Terms in Euler Diagrams: Peirce’s Solution
Moktefi, Amirouche (et al.)
Visualising the Boolean Algebra B4B4 in 3D
Smessaert, Hans (et al.)
Single Feature Indicator Systems in the Openbox
Barker-Plummer, Dave (et al.)
Effective Representation of Information: Generalizing Free Rides
Stapleton, Gem (et al.)
Related Info
http://www.diagrams-conference.org/2016/Welcome.html


 Find a book


 eBook
eBook