
Using spatial analysis to understand Asia’s history of water
This is a series of articles highlighting some of the research projects at the University of Tokyo registered under its Future Society Initiative (FSI), a framework that brings together ongoing research projects that contribute to the United Nations Sustainable Development Goals (SDGs).
FSI Project 012
In recent years, problems concerning water have been at the forefront of discussion around the world, but water has always had a special meaning in Asia.
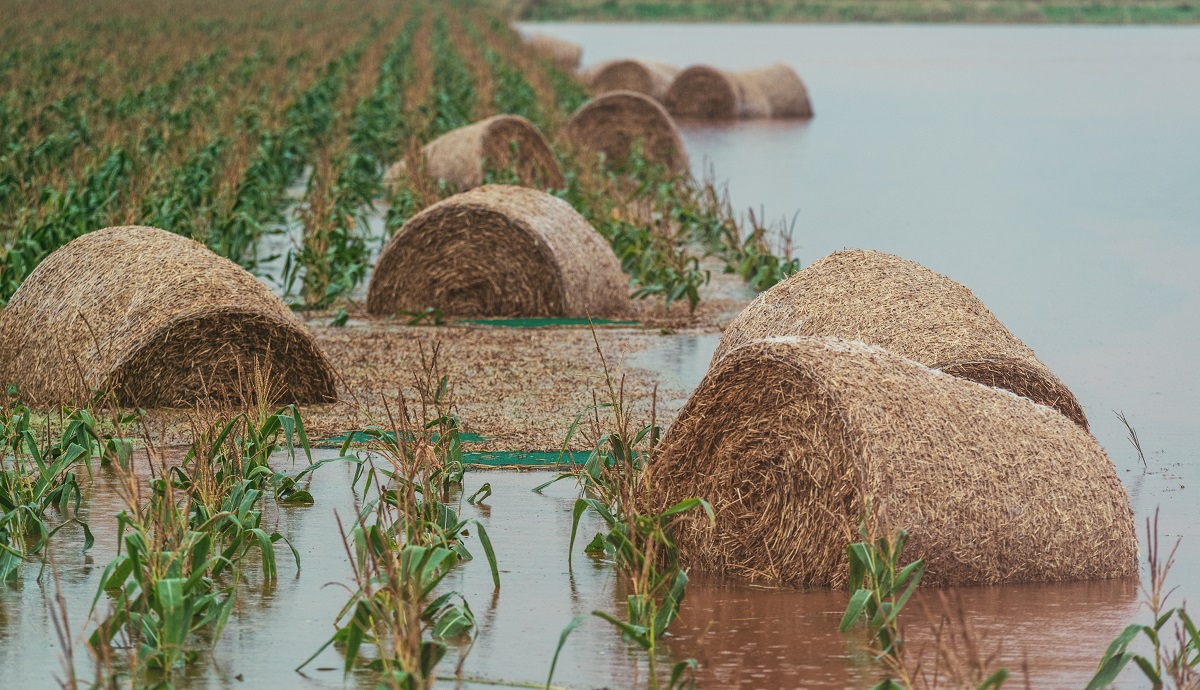
As one can tell by looking at the world map, a vast part of Asia is covered in ocean, rivers, lakes and swamps. Asia’s widespread culture of rice cultivation is due to humid weather brought by the monsoon. Seasonal rainfall is “manna from heaven,” but at the same time it can also bring harm through flooding.
“From that standpoint, we thought of using ‘water’ as a new entry point for the rethinking of Asian history,” said Professor Tomoko Shiroyama, a specialist in Chinese economic history, who leads this project that combines science with the humanities.
This research is unique in that while attempting to re-examine history, it uses data from geographical and atmospheric information to take a geographical information systems approach to visualizing the past. Historians have up till now used mainly ancient texts and such literary information for analysis. Project Professor Akiyuki Kawasaki’s research team from the Graduate School of Engineering combined historical information on climate and hydrologic relations with elevation data from the United States Geological Survey and rainfall data from the National Oceanic and Atmospheric Administration in the U.S. to model past natural phenomena and climate as a whole.
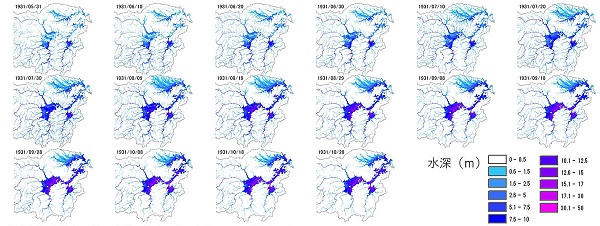
Simulation image of the Yangtze River flood from May 31 to October 28, 1931. Based on various data at that time, it can be inferred how the flooded area had expanded.
A simulation of the Yangtze River flood in July 1931, said to be the worst flooding in history, made it clear what month and what day various areas of the Yangtze River were flooded until. According to Shiroyama, what you combine with such flood simulations is important in developing a spatial understanding of nature and society.
“For example, if we overlap geographical information on flooding and data on the number of plague patients, we can see when and how water pollution spread; combining it with data on grain harvests can give us an idea of the impact flooding had on agriculture,” said Shiroyama.
One day, such visualizations may become a common part of the study of history.
SDGs supported by this project


Professor Tomoko Shiroyama | Graduate School of Economics
Related links
- UTokyo FSI

- The Hydrosphere and Socioeconomics in Modern Asia (FSI project page)
- Future Society Initiative Magazine