

Adding a splash of color, history to weather Scientists investigate climate using isotopes, old diaries
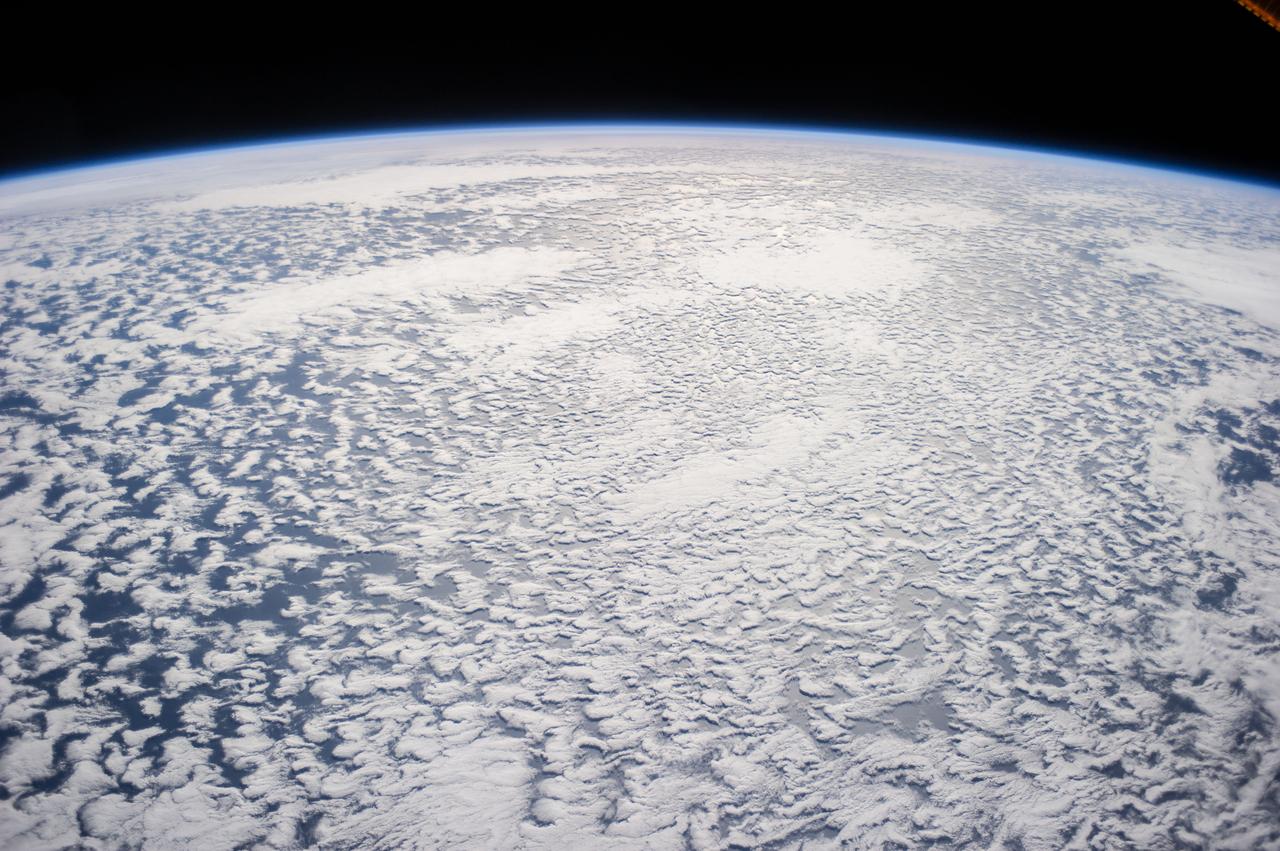
An image of Earth taken from the International Space Station. Exactly how water vapor moves in the atmosphere remains unknown. NASA
Water can be a blessing or a curse.
In nature, the shortage of water can cause droughts and result in wildfires, while an overabundance could also spell trouble, drowning a city with floods and washing away humans and structures with a tsunami.
Yet so much about how water circulates around the surface of the globe and drives weather changes remains unknown. Kei Yoshimura, an associate professor of hydrology at the University of Tokyo, is trying to crack the mysteries of water circulation processes on Earth, and use his insight to improve weather forecasts and reconstruct weather patterns of the past.
One of the resources he uses is stable isotopes — different naturally occurring forms of chemical elements such as oxygen and hydrogen whose subtle differences in atomic weight can be used to track the movements of water molecules. And recently, he has turned to handwritten diaries from as far back as the 17th century to get a better idea of what climate conditions were like back then.
“What I’m doing is similar to a criminal investigation,” Yoshimura said recently at his office on the university’s Kashiwa Campus in Chiba Prefecture. “I’m looking for clues on how to understand the weather and climate better. So I would use stable isotopes as a tool. Looking at isotopes helps me create a hypothesis. Then I would go into the field to confirm if my hypothesis is in fact correct.”
Isotopes as “tags” of water
© 2019 The University of Tokyo.
Yoshimura started studying isotopes in 2000 after he joined the lab of UTokyo Professor Taikan Oki, a prominent scholar on global water cycles, as a master’s student. That year, the university’s Institute of Industrial Science, which had just moved from Tokyo’s Roppongi district to its current location in the capital’s Komaba area, had acquired a bulky instrument called an isotope mass ratio spectrometer.
Oxygen in water comes in heavy and light varieties, which are the isotopes. Most oxygen atoms have eight positively charged subatomic particles called protons and eight electrically neutral particles called neutrons, and are identified as 16O to denote the total number of the particles. However, a very small share of oxygen atoms, denoted as 18O, carry the same number of protons (eight), but have 10 neutrons instead. A mass ratio spectrometer can measure the ratio, or the relative amount, of the rarer, slightly heavier type of oxygen in water molecules.
Stable isotope ratios shift when water changes form between liquid (water) and gas (water vapor) through evaporation and condensation. Water molecules containing “light” oxygen evaporate more quickly than ones with “heavy” oxygen, while water vapor containing heavy oxygen tends to condense and become rain or snow more readily than “light” oxygen.
Tracking the ratio of 18O to 16O contained in water molecules can thus offer researchers a clue on the amount of rainfall and help determine the temperature, as well as where and how water has repeated its evaporation and condensation cycles, because the history of its phase changes is reflected in the ratio, Yoshimura explained.
“Water samples with the same isotope ratios don’t mean their origin is the same, because they might match by accident,” he said. “But when you combine the isotope ratio information with other kinds of data, you can sometimes tell whether the water samples originate from the same place or not.”
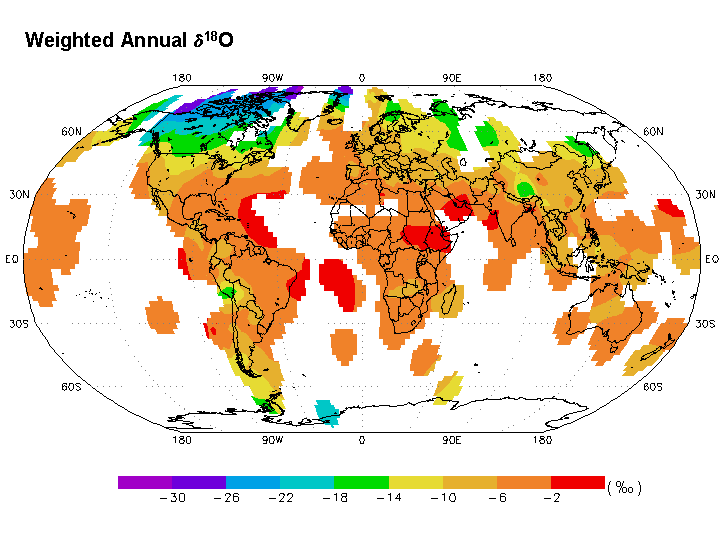
A graphical representation of 18O created by the International Atomic Energy Agency shows that light water (colored purple and blue) is concentrated in polar regions.
Source: http://www-naweb.iaea.org/napc/ih/documents/userupdate/Waterloo/#Acknowledgements
As an example, Yoshimura cites research he has done on the impact of deforestation on climate in Thailand. While it was widely assumed that the continuous cutting down of trees in the Southeast Asian country over the decades had led to a decrease in rainfall there, data from one year showed that rainfall markedly dropped in September, but not in August. When he analyzed ratios of stable isotopes in Thailand during that year, he found that the ratios fluctuated widely, though the temperatures there remained the same and deforestation continued in both August and September.
So, based on his isotope analysis, Yoshimura carried out a computer simulation on where the water vapor originated, putting “tags,” or “colors,” on where it came from.
“I categorized Thailand’s clouds into, say, 50 percent coming from the Bay of Bengal, 20 percent coming from Indochina, and so forth,” he recalled.
The simulation showed that, of the water vapor in Bangkok’s skies at the beginning of the rainy season in mid-May, the ratio of water from the Indian Ocean in the south spiked and remained at high levels through September, when the ratio of land-borne vapor, mainly from mainland China, surged.
The September water vapor in Bangkok was therefore made up mostly of water from the north, which means the disappearance of rainforest inland translated directly into less precipitation, while rainfall in August remained intact because that month’s water vapor had largely originated from the Indian Ocean, keeping the effect of deforestation at bay, he said.
“This was a discovery that meteorologists found interesting,” Yoshimura said, noting that mainstream meteorologists had long regarded the use of stable isotopes with a degree of skepticism. “The idea that you can assign different colors to water vapor was new to them.”
Looking into old diaries
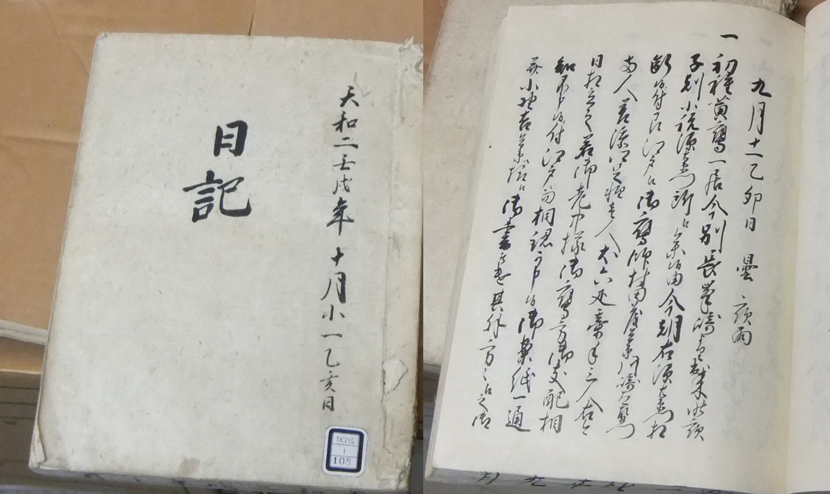
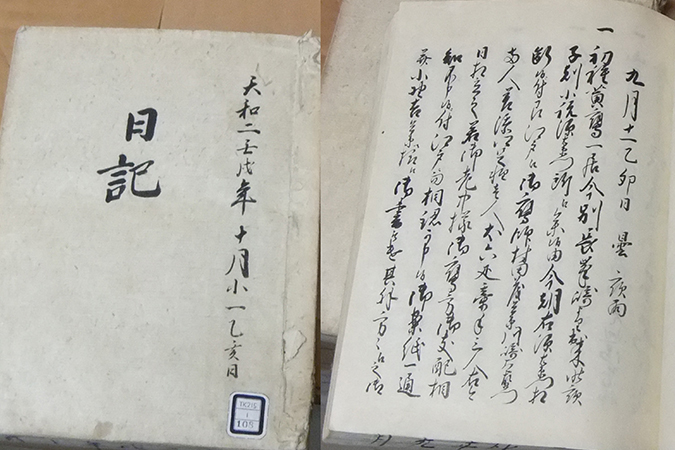
An Edo-Period diary recorded by the Hirosaki domain in present-day Aomori Prefecture.
As with diaries today, an old Japanese diary entry typically starts with a date and the day’s weather.
The diary is in the collection of the Hirosaki City Public Library. Photo courtesy of Tokyo Metropolitan University Professor Emeritus Takehiko Mikami.
Yoshimura’s eagerness to break with convention in climate research has taken a new twist lately. For the past several years, he has extracted weather data from old diaries to reconstruct climate models of past centuries. He has used information originally collected by feudal domain offices and shrines across Japan between 1661 and 1892, which researchers led by Minoru Yoshimura (no relation), professor emeritus at Yamanashi University, have converted into a digital form and made public on the website Historical Weather Database.
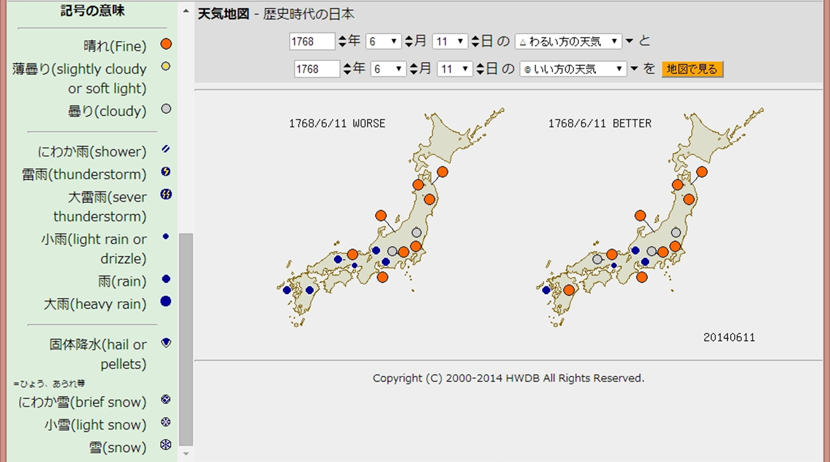
A screenshot of the Historical Weather Database website shows weather data on June 11, 1768.
The hydrologist is also collaborating with Yasuyuki Kano, an associate professor of seismology at UTokyo’s Earthquake Research Institute (ERI), to refine his computer simulations of past weather. Kano has used diaries written in the Edo Period (1603-1867) for his earthquake research.
© 2019 The University of Tokyo.
Kano has played a key role in a grass-roots internet project called Minna de Honkoku (roughly translated as “Transcribing with Everyone”), through which over 300 volunteers — including academics and the public — have transcribed more than 472 earthquake reports from the Edo Period. All of the transcribed documents are sourced from a digital collection of earthquake records managed by the ERI Library at UTokyo. Since the launch of the transcribing project in January 2017, the volunteers have deciphered over 5 million characters written in kuzushiji (a cursive, running style that is illegible to most Japanese people today).
Kano, one of very few seismologists trained to read such old Japanese texts firsthand, picked up the skill by participating in weekly reading sessions hosted by a group of researchers and students at Kyoto University, where he worked until he landed his current ERI post in July.
Kano says that by participating in the Minna de Honkoku “open science” project, citizens can become aware of past earthquakes in their communities. He also believes that old data can help seismologists better forecast future jolts.
The very first historical document he and other members of the Kyoto-based study group tackled was a report written by officials of the midsize Matsushiro feudal domain that ruled the present-day city of Nagano, Nagano Prefecture. The document was produced soon after the area was hit by a major temblor, known as the Zenkoji Earthquake, in 1847.
“It was an official report intended to be read by the Tokugawa Shogunate so the domain could apply for financial assistance from the shogunate,” Kano said. “Some of those reports start with a date and the day’s weather. Also, old diaries sometimes contain a description of an earthquake, including what time it took place, along with the day’s weather. By reading those reports and diaries I learned that the weather was logged on a daily basis and had always wondered if I could find a use for such information.”
Reconstructing climate from 1,000 years ago
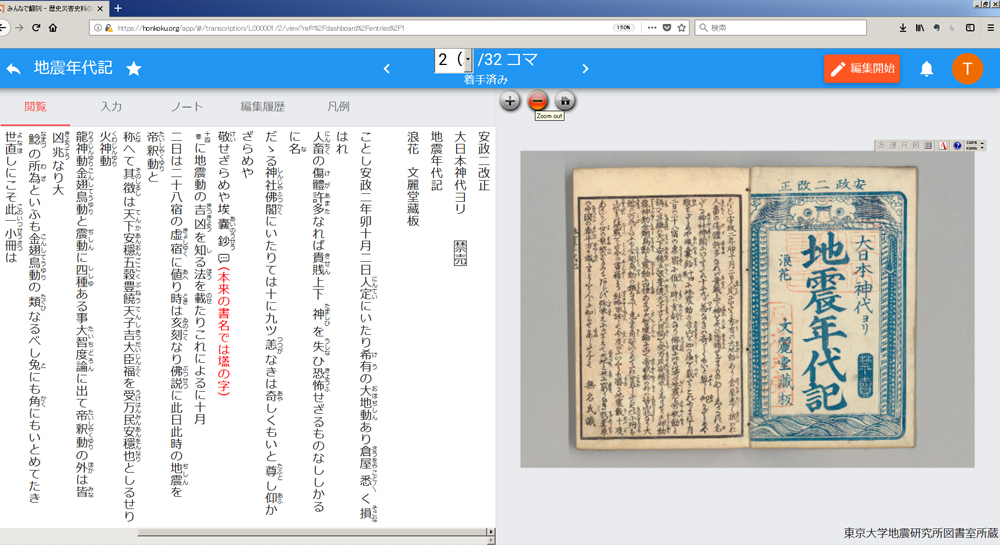
A screenshot of the Minna de Honkoku website shows the cover and the first page of a book detailing the history of earthquakes in Japan on the right, while transcribed texts are shown on the left.
Yoshimura says he finds such old weather data useful in improving long-term climate models.
Meteorological observation using instruments has such a short history that modern data alone are not sufficient to accurately simulate weather in the long term, he said.
“Organized meteorological observation started in wide parts of the world only after World War II,” he said. “Before that, such observation was limited to a few places including the U.K. and Japan, but their data are only about a century old. We are simulating climate far into the future, like in 2100 and 2200, based only on decades-long data. How accurate can that be?”
Yoshimura is also trying to look back in history and reconstruct climate models from the past millennium to consider their impact in shaping events leading to the present.
“There are a lot of unknowns in our history,” Yoshimura said. “We know there was a medieval period called the Little Ice Age, when Europe was supposedly exposed to exceptionally cold winters. We also know that a period called the Medieval Warm Period existed in the 10th to 14th centuries and how the Germanic migrations even before that might have been triggered by climate change. But the fact is, we really don’t know what exactly happened back then.”
Yoshimura is particularly keen to learn about the weather condition of one day in 1600, known as a watershed moment in Japanese history.
October 16, 1600, is the day when the Battle of Sekigahara erupted between the then-regional warlord Tokugawa Ieyasu and rival Ishida Mitsunari in the fields of Sekigahara in present-day Gifu Prefecture.
Ieyasu’s victory in that famous samurai battle paved the way for the establishment in 1603 of the Tokugawa Shogunate, the last feudal military government in Japan, which lasted 260 years.
“Wouldn’t it be exciting if we could find out what the weather was like there and around the world on that day?”
Interview/Text: Tomoko Otake