

Making a mathematical model of COVID-19
Dispatches from the coronavirus crisis
We selected 10 researchers from among the University of Tokyo’s 26 constituent departments and asked them to write one-page accounts of the coronavirus pandemic from the perspective of their own field of specialization. This also presented the opportunity for them to attempt to frame their own research through the lens of the pandemic.
What were UTokyo researchers thinking and feeling in the summer of 2020? What do researchers say when they are talking about the pandemic? Some answers to these questions will be found in this series of pages.

Making a mathematical model of COVID-19

Mathematical Biology
Associate Professor at the Graduate School of Science
COVID-19 is spreading on an unprecedented and global scale. Until a vaccine or remedy is developed, we will need to put in place measures to prevent the number of infections from growing at an explosive rate. Mathematical models can play an active role here. These are models that mathematically describe various phenomena using equations. Mathematical models of infectious disease are described using continuous differential equations, and even models that are difficult to solve analytically can be calculated with ease using spreadsheet software so long as they are numerical calculations.
For the case that no measures were put in place, we assumed that each infected person causes the secondary infection of 2.5 others (this was the estimated value for Wuhan in China), to calculate changes over time in the number of COVID-19 infections using an SEIR model in which individuals in the population were divided into the four categories susceptible (S), exposed (E), infectious (I), or recovered (R). As a result, we found that the number of infectious cases peaked after five months, and that this peak period corresponded to an uncontrollable state in which about 15% of the population was infected. Conversely, we found if the frequency of contact with other people were to be kept at or below 40% of the current level, then infections would not spread, and that even if frequency could be kept at around 45%, it would still be possible to push back the peak to two years or more.
When a person catches an infectious disease, the body creates antibodies to eliminate pathogens like viruses and bacteria. This kind of system is called immunity. When you are inoculated with a vaccine, the immune system can produce antibodies ahead of time to prevent infection before it occurs. In the case of the measles virus, once a person is infected, the immune system works to prevent subsequent infections. This is called lifelong immunity. However, humans are unable to acquire lifelong immunity to the typical coronavirus or influenza virus. Nor is it thought to be able to be acquired against COVID-19. Some reports have described antibodies against COVID-19 disappearing from the body of previously infected individuals within a few months. And if we cannot acquire lifelong immunity, there will be the possibility to be infected multiple times. When we calculate using a mathematical model (SEIRS model) assuming that immunity will disappear within one year on average, we find that even if some degree of measures were to be taken, after reaching the peak for a multiple-infection epidemic, we will have fallen into a state of equilibrium in which approximately 1% of the population will always be infectious (Figure). From this result, as well, we can understand the urgency to develop a vaccine. Mathematical models of infectious diseases have a lot to teach us.
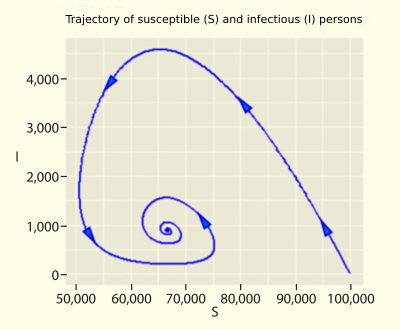
*S=Susceptible, E=Exposed, I=Infectious, and R=Recovered
* This article was originally printed in Tansei 41 (Japanese language only). All information in this article is as of September 2020.