Using numerical simulations to approach climate variability between the atmosphere and the ocean Two shades of pale blue that affect the global environment

A collection of research and educational activities related to the birthplace of all life
The year 2021 marks the start of the United Nations Decade of Ocean Science for Sustainable Development, a major campaign to advance the science of the ocean, which is the birthplace of all life and sustains the lives of organisms on Earth. This year, the University of Tokyo welcomed as its new president a scientist who has lived and worked with the ocean. From engineering, physics and biology to agriculture, law and economics, we introduce UTokyo’s ocean research and marine education activities as illustrated by examples from various fields.
| Climate Dynamics |
Using numerical simulations to approach climate variability between the atmosphere and the ocean
 By Yukio Masumoto By Yukio MasumotoProfessor, Graduate School of Science |
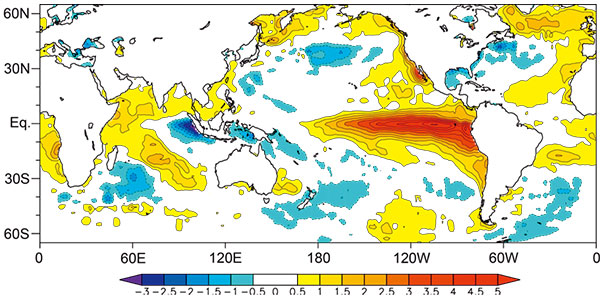
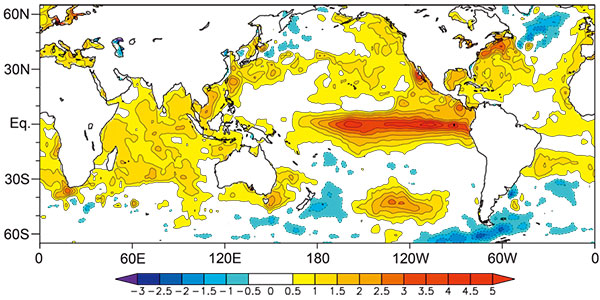
El Niño is a phenomenon in which the surface temperature in the equatorial area of the Pacific Ocean remains higher than in normal years for an extended period. A key element found in the process of exploring the mechanism of this phenomenon is how the atmosphere and the ocean interact with each other. Professor Yukio Masumoto, a specialist in the physics of atmospheric and ocean circulation, outlines his research into climate variability that continues to take place even today between the blue atmosphere and the ocean.

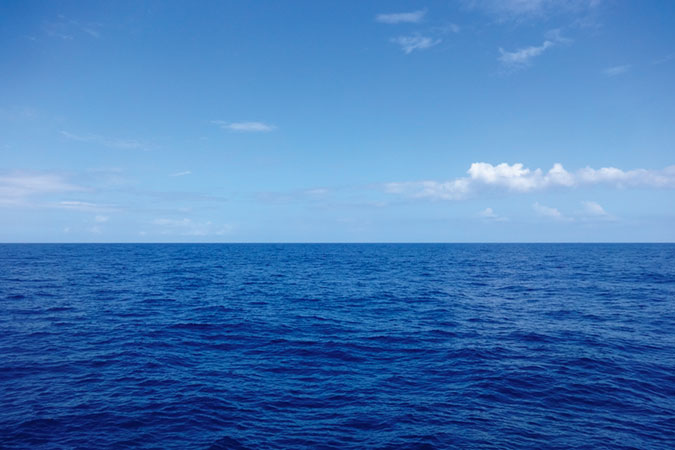
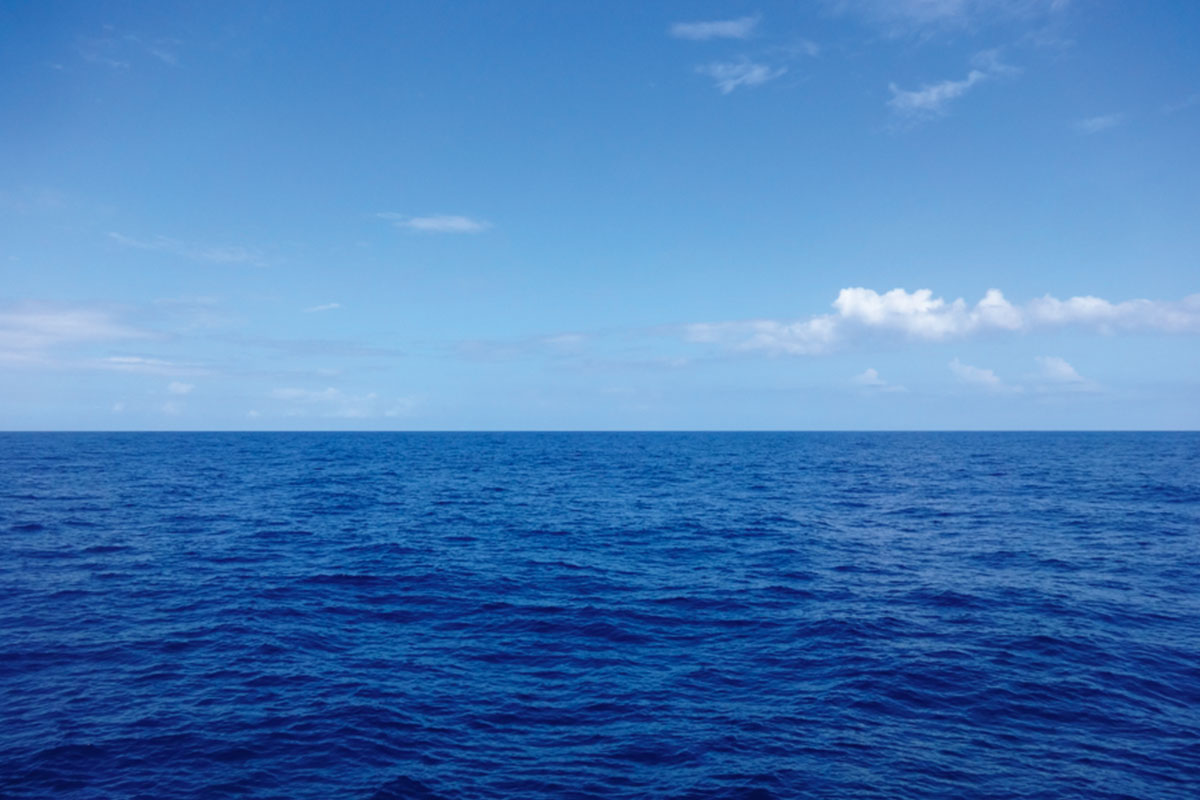
Pale blue (tansei) is the color of the ocean. It is also the color of the atmosphere. Climate variability takes place where these two shades of blue overlap. In climate variability, the ocean and atmosphere play leading roles as two different fluids that influence each other and connect to form a single large structure that slowly develops over the course of months, years and decades. Climate variability is made up of the repetition of changes – such as in air and water temperature, wind and currents, as well as precipitation – that spontaneously appear and disappear as the Earth’s natural rhythms. The perpetual rhythms underlie extreme weather events such as the “cold summer” and “time of drought” immortalized by poet and author Kenji Miyazawa [in his poem “Ame ni mo makezu (Be not Defeated by the Rain)”], and that we humans are at their mercy hardly bears mentioning. So why and how does this climate variability occur? When, where and in what manner will it take place? Can this be predicted? I have been considering such questions in my research.
The oceans and atmosphere form an extremely complex system in which phenomena on a variety of spatial and temporal scales – from tiny oscillations to global circulations – form hierarchical structures that exert a mutual influence on each other. Thus, though they may behave in an organized manner on the whole, we find many cases in which each of the constituents acts freely according to its own rules. While this complexity creates a variety of climate variations, which is part of the appeal in elucidating their mechanisms, it also contributes to our difficulty understanding them.
The El Niño phenomenon that occurs in the Pacific tropics is well known as a typical example of such climate variability. The idea of interaction between ocean and atmosphere has also drawn attention in the course of elucidating the mechanisms by which the El Niño develops, and has dramatically advanced our understanding of the phenomenon. At the University of Tokyo, a wide range of research is underway with regard to our theoretical understanding and modeling of the atmosphere-ocean interactions that are essential for many climate variations, including El Niño, as well as in terms of understanding their mechanisms – and even their predictability – using observational data and numerical simulation results. Today, we understand much more about the mechanisms behind certain typical climate variabilities, and it is now possible to make rather accurate predictions using numerical models. Of course, the predicted results can still deviate from those in the real world. This may stem from an incomplete understanding of the physical processes that cause fluctuations in the ocean and atmosphere, or else an inadequate understanding of the interactions that occur between different physical processes. To fill these gaps, we are making daily progress with research that deepens our understanding of these complex but interesting climate variabilities.
In recent years, human activity has begun to exert an effect on these climate variabilities as well. Anthropogenic increases in greenhouse gases affect the oceanic and atmospheric processes that shape climate variability. Moreover, with differences arising between ocean-atmosphere interactions and interactions between different layers of the hierarchy, the climate variabilities that have occurred in the past as natural rhythms will manifest themselves in new and different forms. With long-term fluctuations, in particular, the role of the oceans, which are able to store substantial amounts of heat, and which move more slowly relative to the atmosphere, will become more prominent. In the future, understanding the mechanisms of climate variability through ocean fluctuations and their role will become increasingly important – not least to safeguard the pale blue beauty of our global environment.


* This article was originally printed in Tansei 43 (Japanese language only). All information in this article is as of September 2021.


