

3D maps capture scope of damage, add new dimension to Ukraine coverage Pinpointing geographical location of satellite images helps paint larger picture of war
Russia’s aggression against Ukraine that began on February 24, 2022, continues to ravage the country, causing large-scale destruction and untold suffering to its people, as well as leaving the world reeling from shock waves felt around the globe. While the media keeps reporting on the situation day after day, it can be difficult to judge what information and sources can be trusted. We caught up with Professor Hidenori Watanave of the Graduate School of Interdisciplinary Information Studies, who has been visualizing data of Ukraine's reality, through the eyes of an information design researcher. He uses satellite imagery and 3D models as tools, which not only visualize the war’s destruction, but could also open the door to a new kind of journalism. Below are excerpts from the interview.
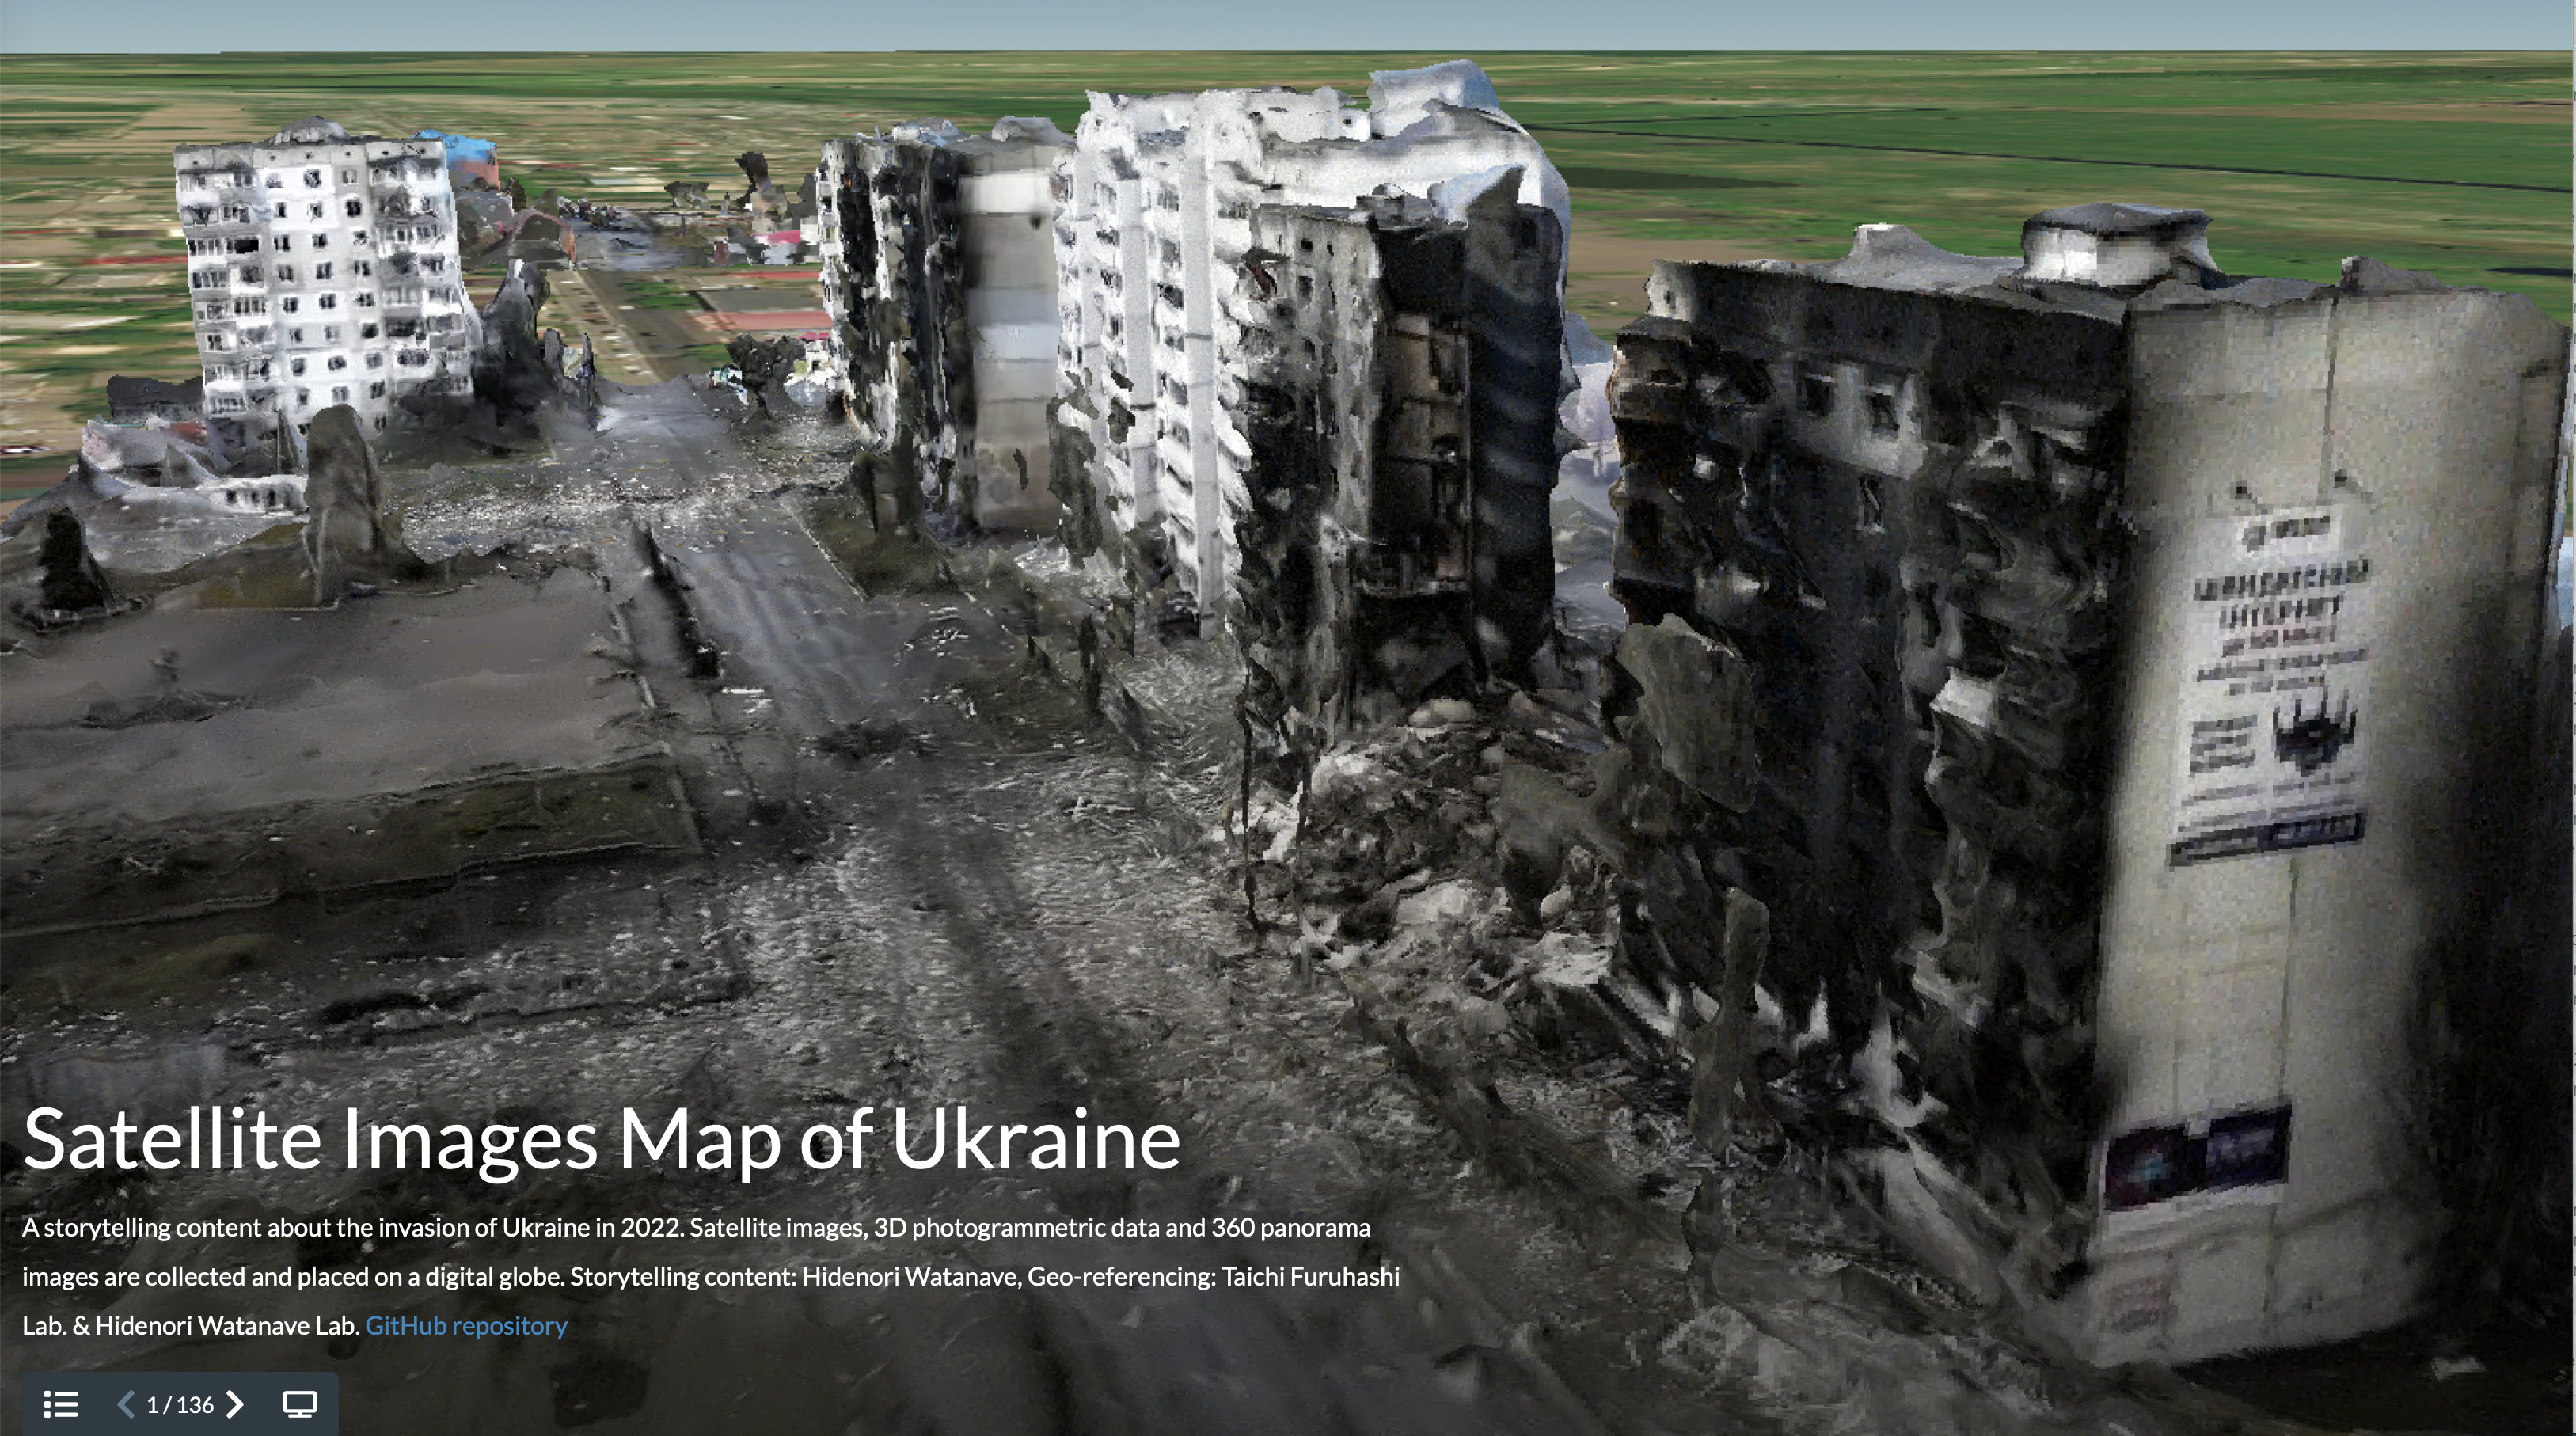
Satellite Images Map of Ukraine. A visitor to the website can view a collection of images conveying the reality of the situation in Ukraine, including flames visible through the window of a damaged building, a convoy of cars turning back in front of a bridge that has been destroyed, and other scenes. The site also includes an image of a luxury yacht owned by a Russian oligarch floating in the waters of the Seychelles.
Mapping satellite images of devastation
――The Satellite Images Map of Ukraine website you launched collects and maps satellite imagery of damage shot from the skies above Ukraine. Would you tell us more about this project?
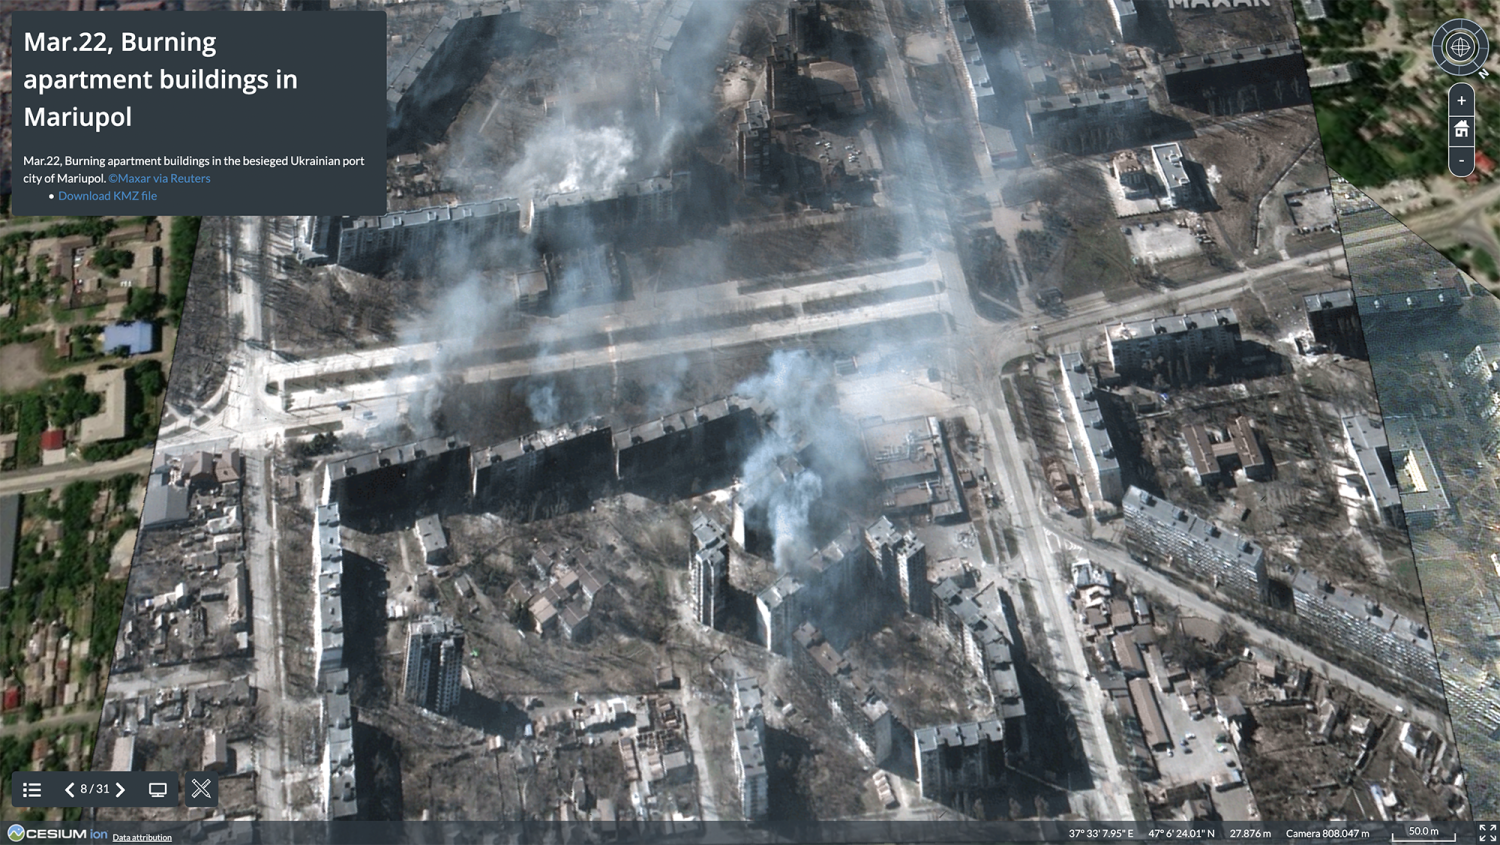
Companies like Maxar Technologies and BlackSky release distinctive images culled from the imagery collected by their proprietary satellites. Such images are circulated around the world through online articles and social media, but they do not provide detailed location data, making it difficult to pinpoint the precise spot in Ukraine that they represent. The only things we recognize are the names of places like the city Mariupol. What our team is working on is locating and identifying on Google Earth the detailed locations of the distributed satellite imagery. Once they’ve been identified, we adjust the aspect ratio, orientation and distortion of the images so that they overlap exactly with the actual locations, and then map and release them through the digital globe platform Cesium.
――How do you identify the location? Do you use some special digital tools?
We have only our own eyes to search with, relying on place names and geographical knowledge. For example, we might refer to a feature like a large parking lot with two large buildings standing next to each other as a clue to narrow down the location. Of course, there are a few tricks. Because the sun synchronous satellites that are used take images approximately at solar noon, the shadow extends due north, which means we can determine the orientation of the image. If we see a large shopping mall, we can guess it is probably located in the suburbs of a city. Professor Taichi Furuhashi of Aoyama Gakuin University (in Tokyo), myself and a team of graduate students share, through the Slack communication platform, satellite images released daily, and one of us will volunteer to search for the specific location of a particular image. This is what we do every day. The location of a large facility such as an airfield is easy to identify, but when it comes to residential areas that have no special characteristics and are difficult to identify by place name, the identification process is very hard. For instance, it was difficult to identify an area lined with small houses in satellite images of Mariupol, but we were eventually able to identify it in about 30 minutes using large buildings and streets as clues. We launched a joint effort on February 24, called together by Professor Furuhashi, and have posted approximately 130 satellite images so far (as of March 25).
Images clearly show attack on nonmilitary facilities
――What are some of the insights that can be drawn from this effort?
With just a satellite image and some evidence that shows it is of Mariupol, there probably isn’t much information you can glean beside the damage being severe. But if you superimpose it on a map and look at the surrounding area, the city’s proximity to the Russian border and the Black Sea becomes readily apparent. Or, for example, if the destruction is along a single road extending from a factory district, we can infer that it was an attack by advancing Russian troops, while an attack on houses in the countryside would indicate that it was a nonstrategic attack on civilians. Another satellite image near the border with Hungary shows a long procession of refugees in their cars. Although the media tends to focus on the capital, Kyiv, there are numerous evacuees near the border. And a comparison of nighttime images across Ukraine with those from before the invasion shows that it is pitch black after the invasion, suggesting that lights are being regulated during the night.
Such satellite images used to be taken by military reconnaissance satellites and were rarely made available to the public. Today, they are provided to the media by private companies, then spread quickly on social media. Unlike during World War II, the military and politicians probably have a harder time lying to the public today. For example, Russia claims that it only attacks military facilities, but satellite images clearly show that they are also attacking nonmilitary facilities and harming civilians. When images are superimposed on a map in this way, as dots are connected to form lines, which in turn form planes, we get a more complete picture of what is happening. These satellite images are powerful on their own, but when combined with location data, they can be mapped together to become even more powerful.
――You post some nonsatellite images, too.
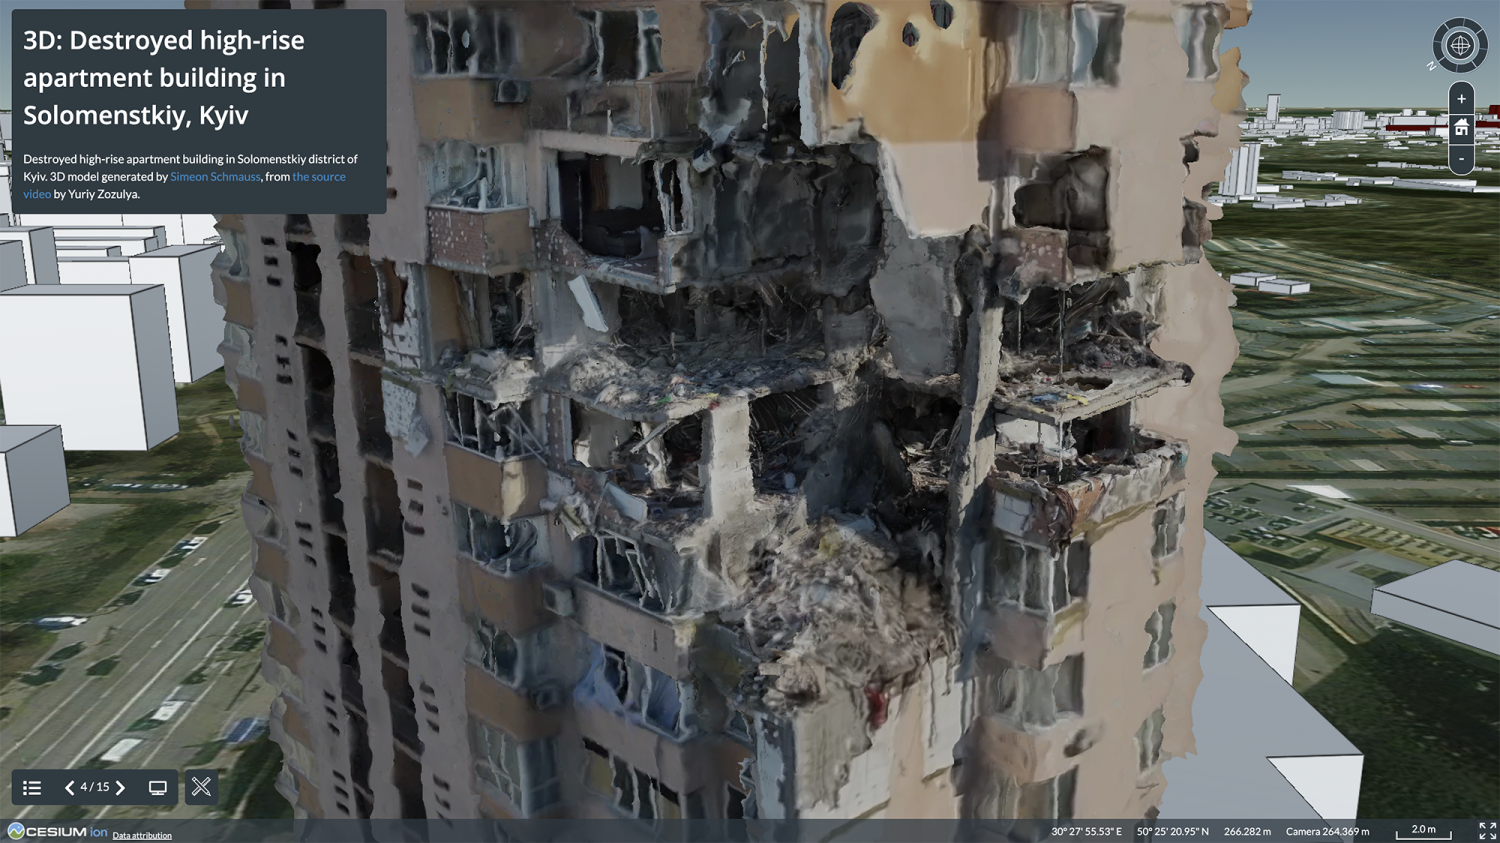
The photos of Borodyanka, a town in the western suburbs of Kyiv, were provided by Simeon Schmauss, a researcher from Germany. He contacted me via Twitter to ask if I could put 3D models he created of damaged buildings on the map. The 3D models were generated using Reuters footage taken by a drone. This technology is called photogrammetry, which allows 3D models to be created from multiple images without the need for precise surveying. We have also been able to contact a person who shared a 3D model of a civilian car that was crushed by a military vehicle, which we have posted as well. A citizen of Donetsk (a city in eastern Ukraine) provided a 3D model of the basement of his apartment complex, which he uses daily as an air raid shelter. He is a 17-year-old native of the city who launched a successful IT startup.
Visualizing data recorded by citizen journalists on the ground
Through such exchanges, we decided to receive and compile data from people who had digitally documented damaged areas. There are people on site who are working hard to document the war and share it with the world. Satellite imagery from high above is combined with information from the perspective of people on the ground. This is a visualization of the reality of war using the new technology of generating 3D models with photogrammetry. In the past, war situations were officially announced by the military or government, or reported by the media. Today, satellite images taken by private companies and data recorded and disseminated by individuals around the world are being used in media reports or, as in our project, mapped together and redistributed. This could be a new form of journalism, or perhaps bottom-up reporting of the war’s progression on a digital map.
I personally approach this war as an information design researcher. My job is to collect data from those trying to document and pass on to posterity Ukraine’s reality during the war, and using the latest technology and design to express and disseminate that reality in a form that is easy to understand. At the moment, our digital map functions as a real-time depiction of the war as it unfolds, but in the future, it may serve as a repository of memories for tracing what happened in this war.
――The Watanave Laboratory has been involved in various efforts to map war and disasters. What are the aims of these efforts?
Nobody wants to go to war, but it still happens. Probably because all the people involved in the war, including government officials, fail to visualize it as something that will happen to them. War happens because of a lack of a sense of ownership and imagination of the people involved. That is why we want to do what we can to block the path leading toward war by visually conveying the events that it causes and stimulating the imagination. Imagination is equally important in natural disasters. The trajectory of the behavior of tsunami victims (of the 2011 Great East Japan Earthquake) visualized in our 2016 project Last Movements of Tsunami Disaster Victims provides insight into how we should act when tsunamis hit. In this way, we must not let our memories and records lapse, but rather connect them to the future. If left as they are, they will not enter our consciousness. We must re-present them in an easy-to-understand manner through information design so that they will reach people's hearts and minds. We intend to continue working toward this end.
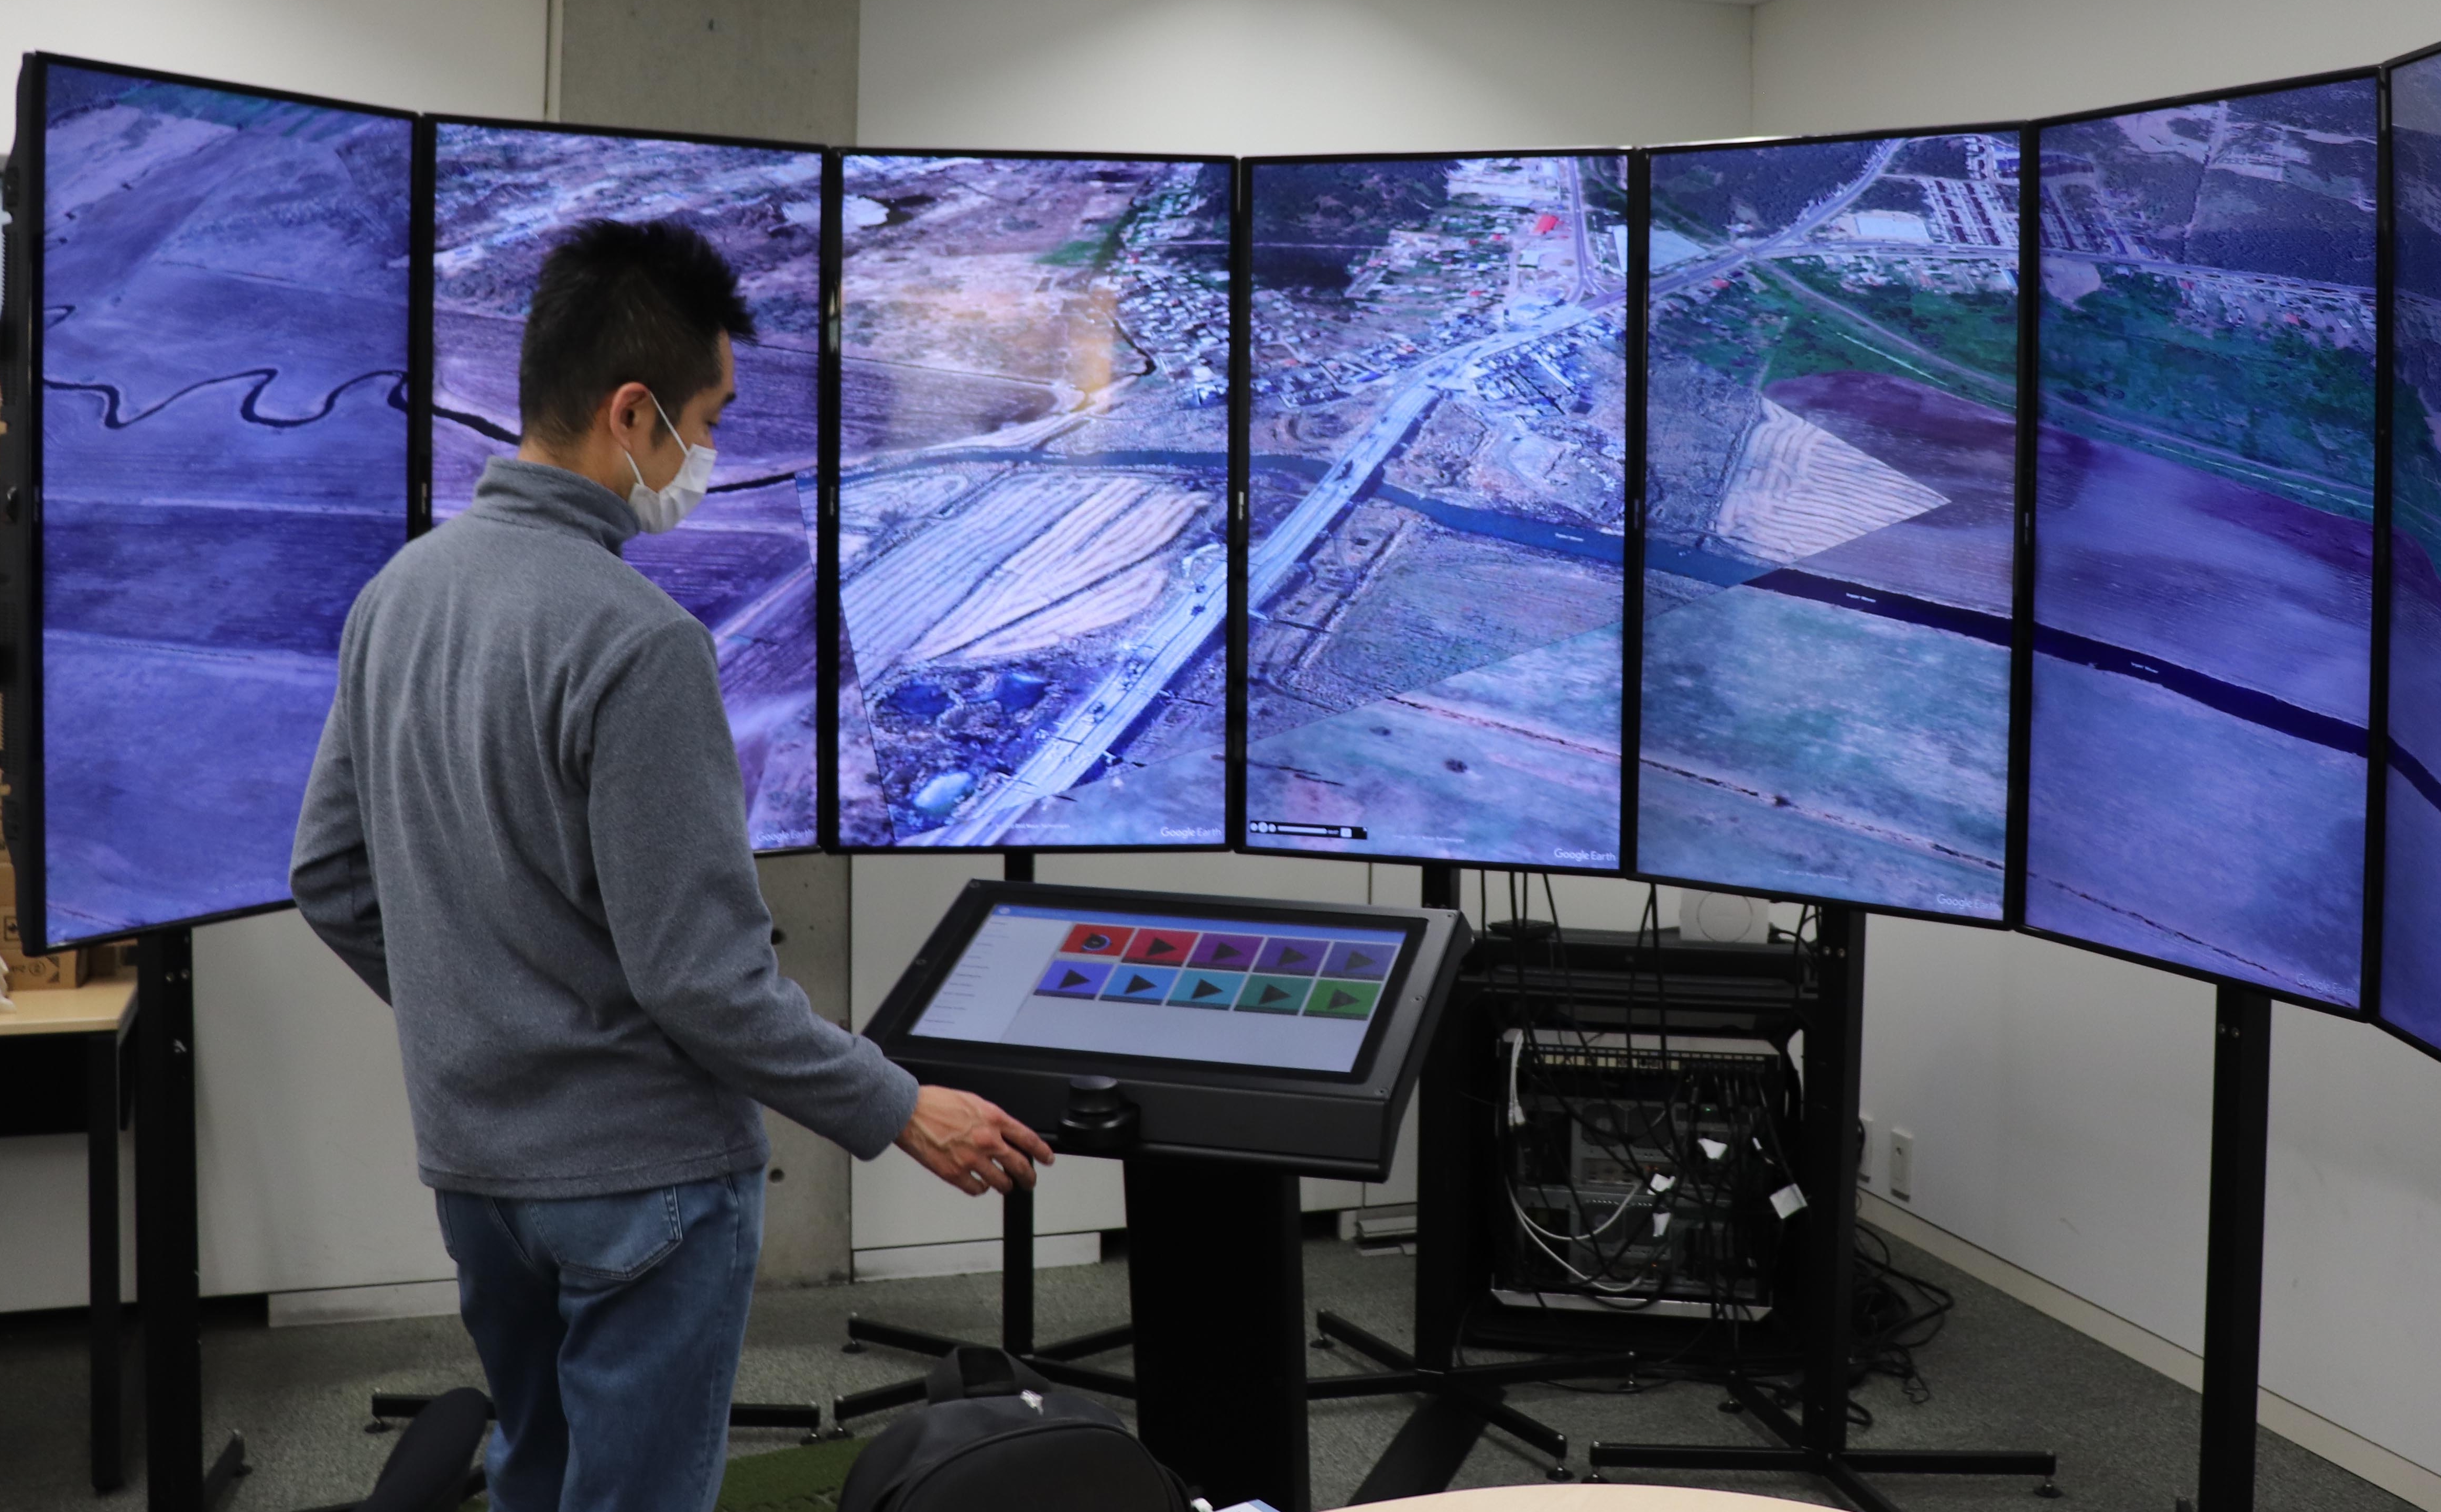
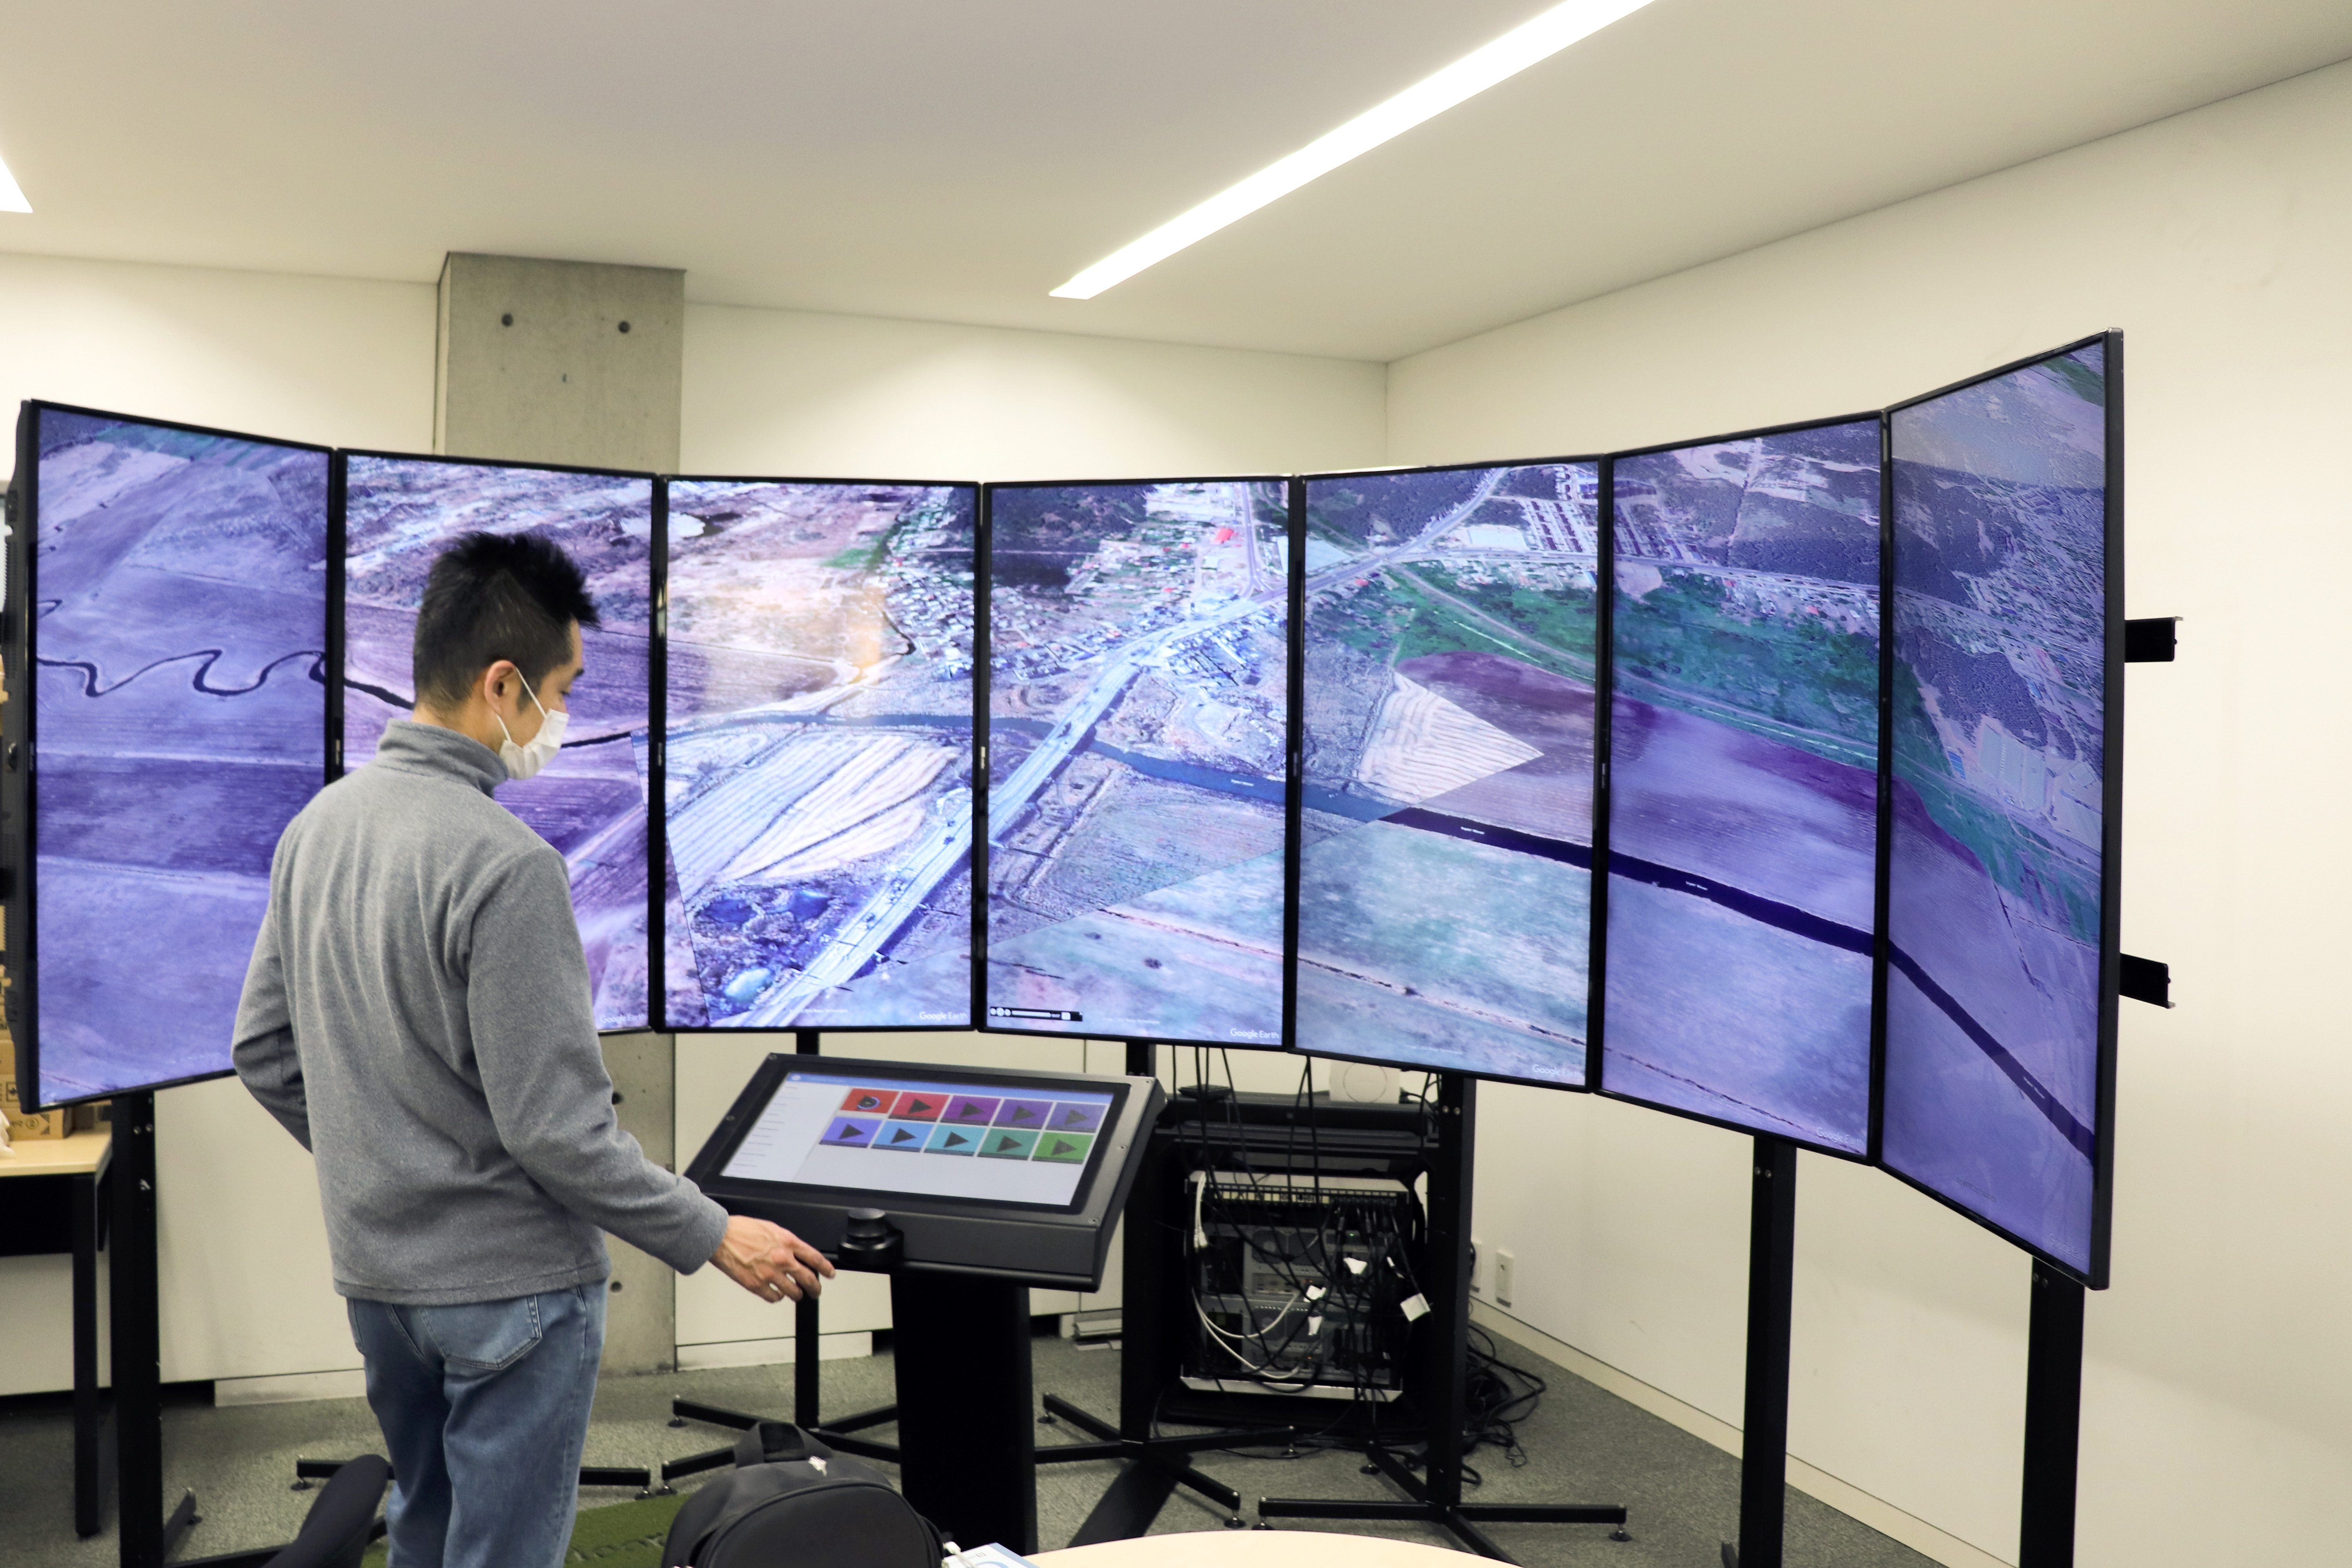 The Liquid Galaxy multidisplay system in the Watanave Laboratory. The system can display Satellite Images Map of Ukraine and various other content produced by the lab, on a large screen. “Unlike smartphones with only one person looking at the screen, multiple people can look at the screen at the same time, and I think the value lies in the fact that the contents can open up conversations among them,” said Professor Hidenori Watanave.
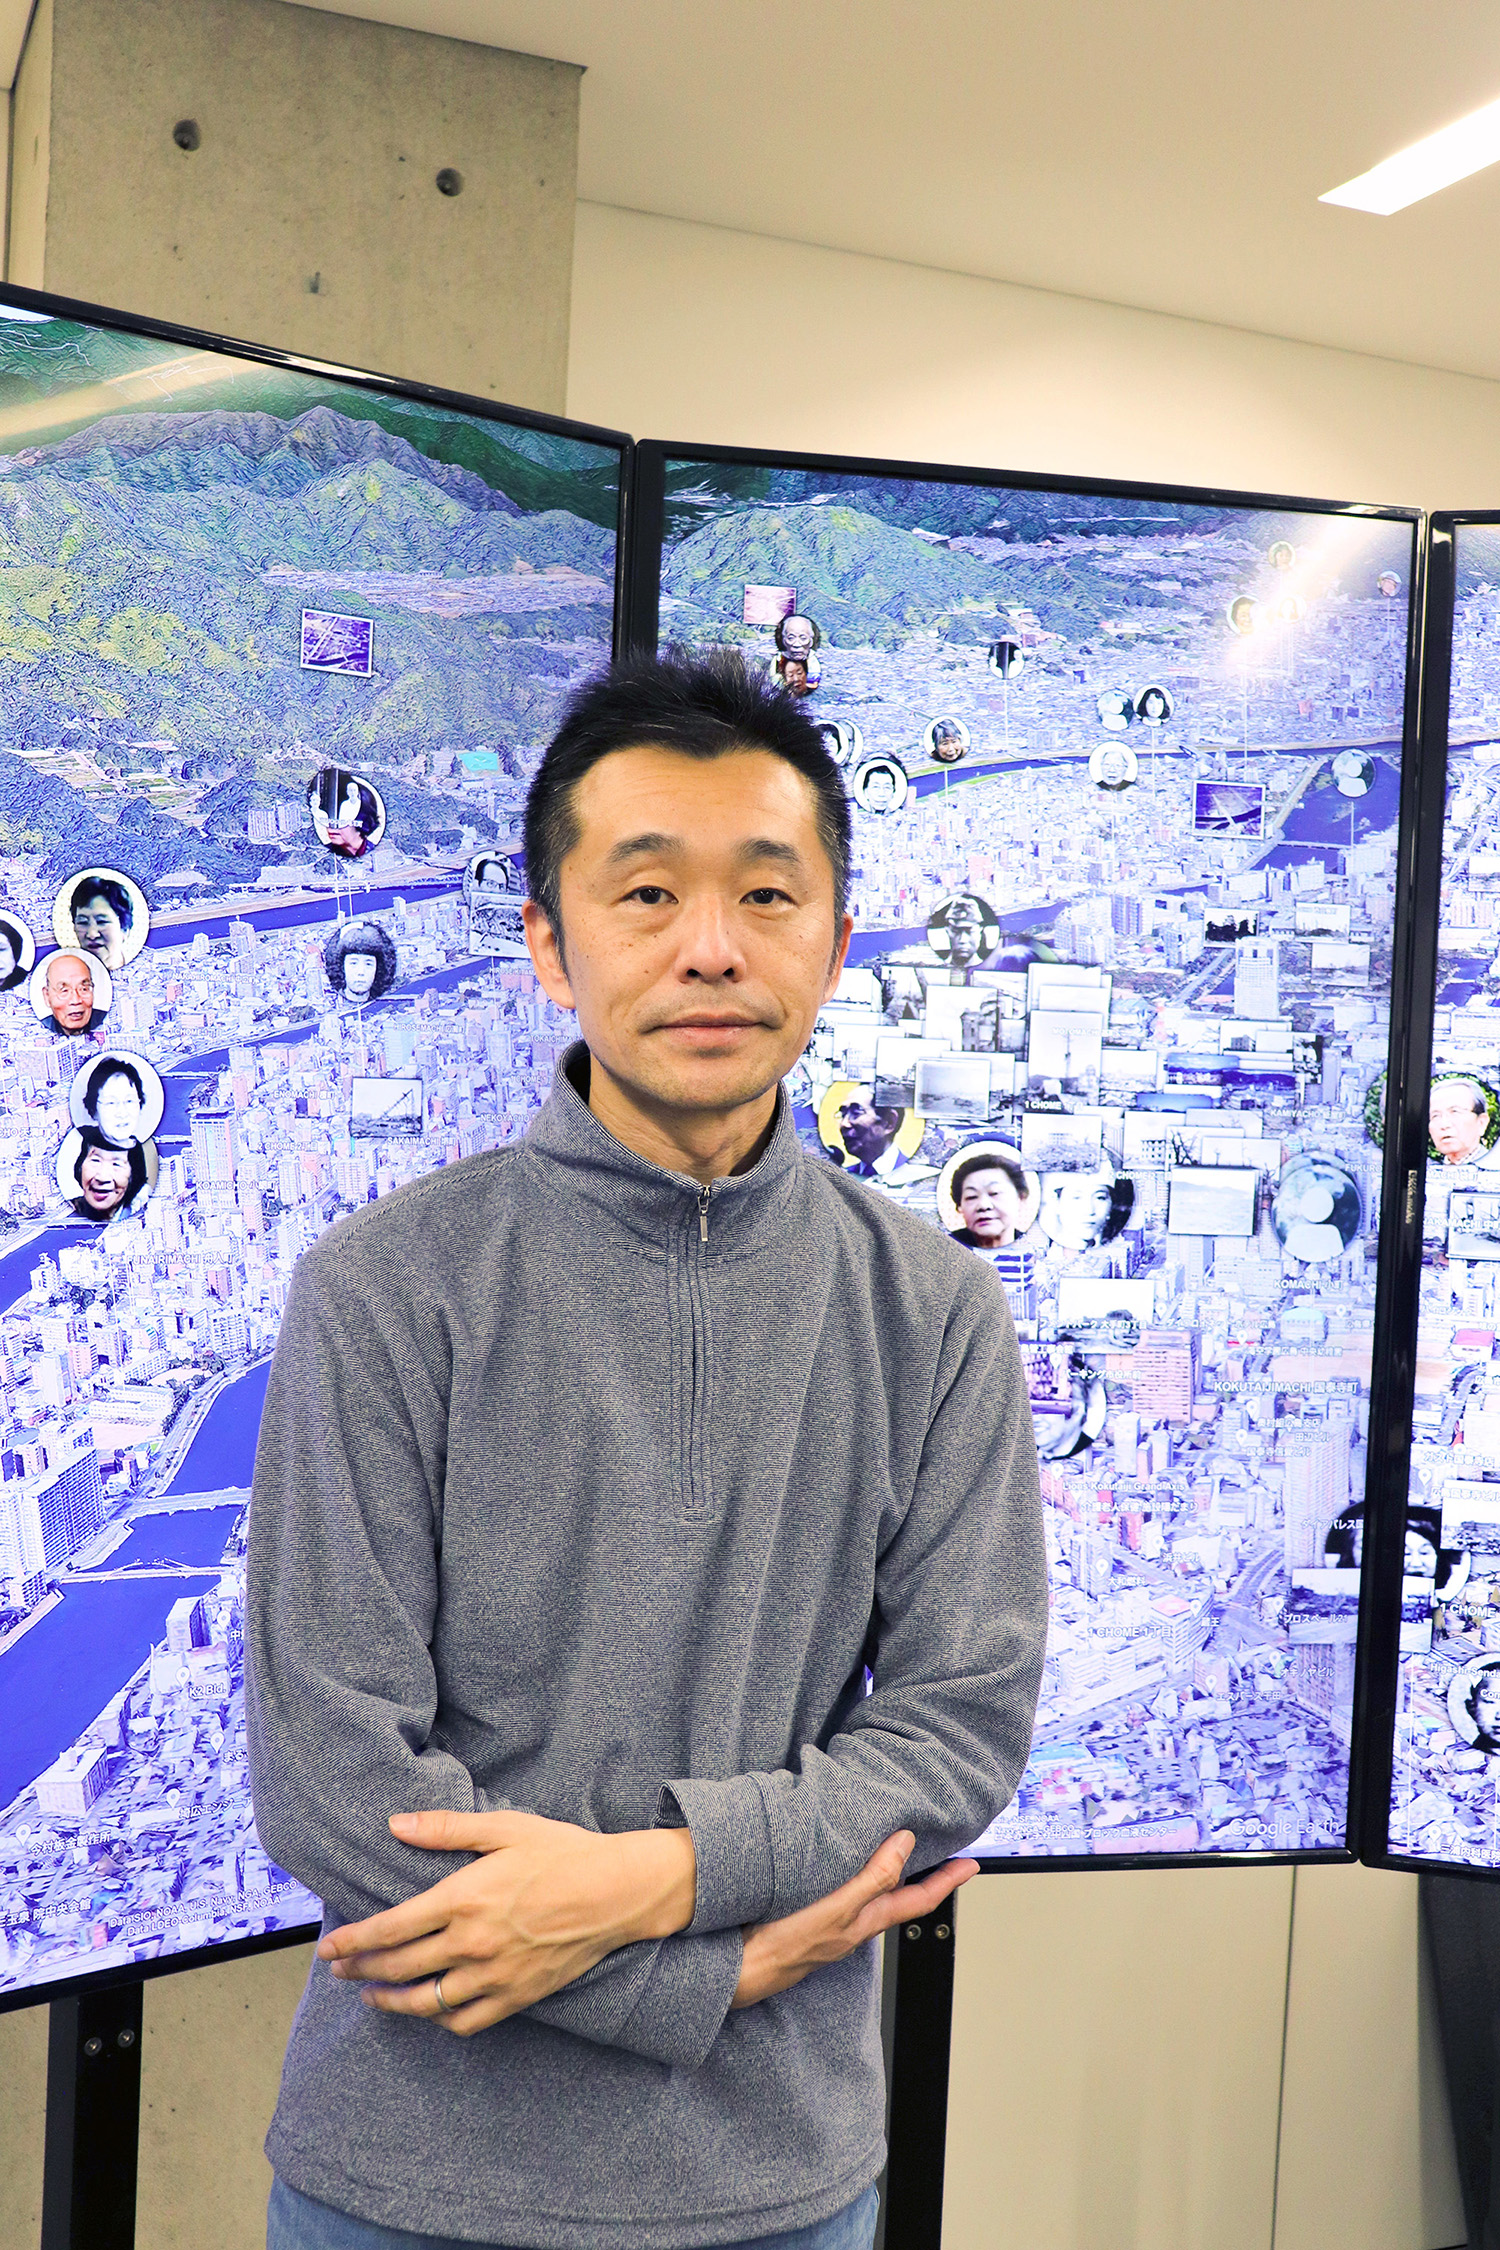
Hidenori Watanave
Professor, Graduate School of Interdisciplinary Information Studies
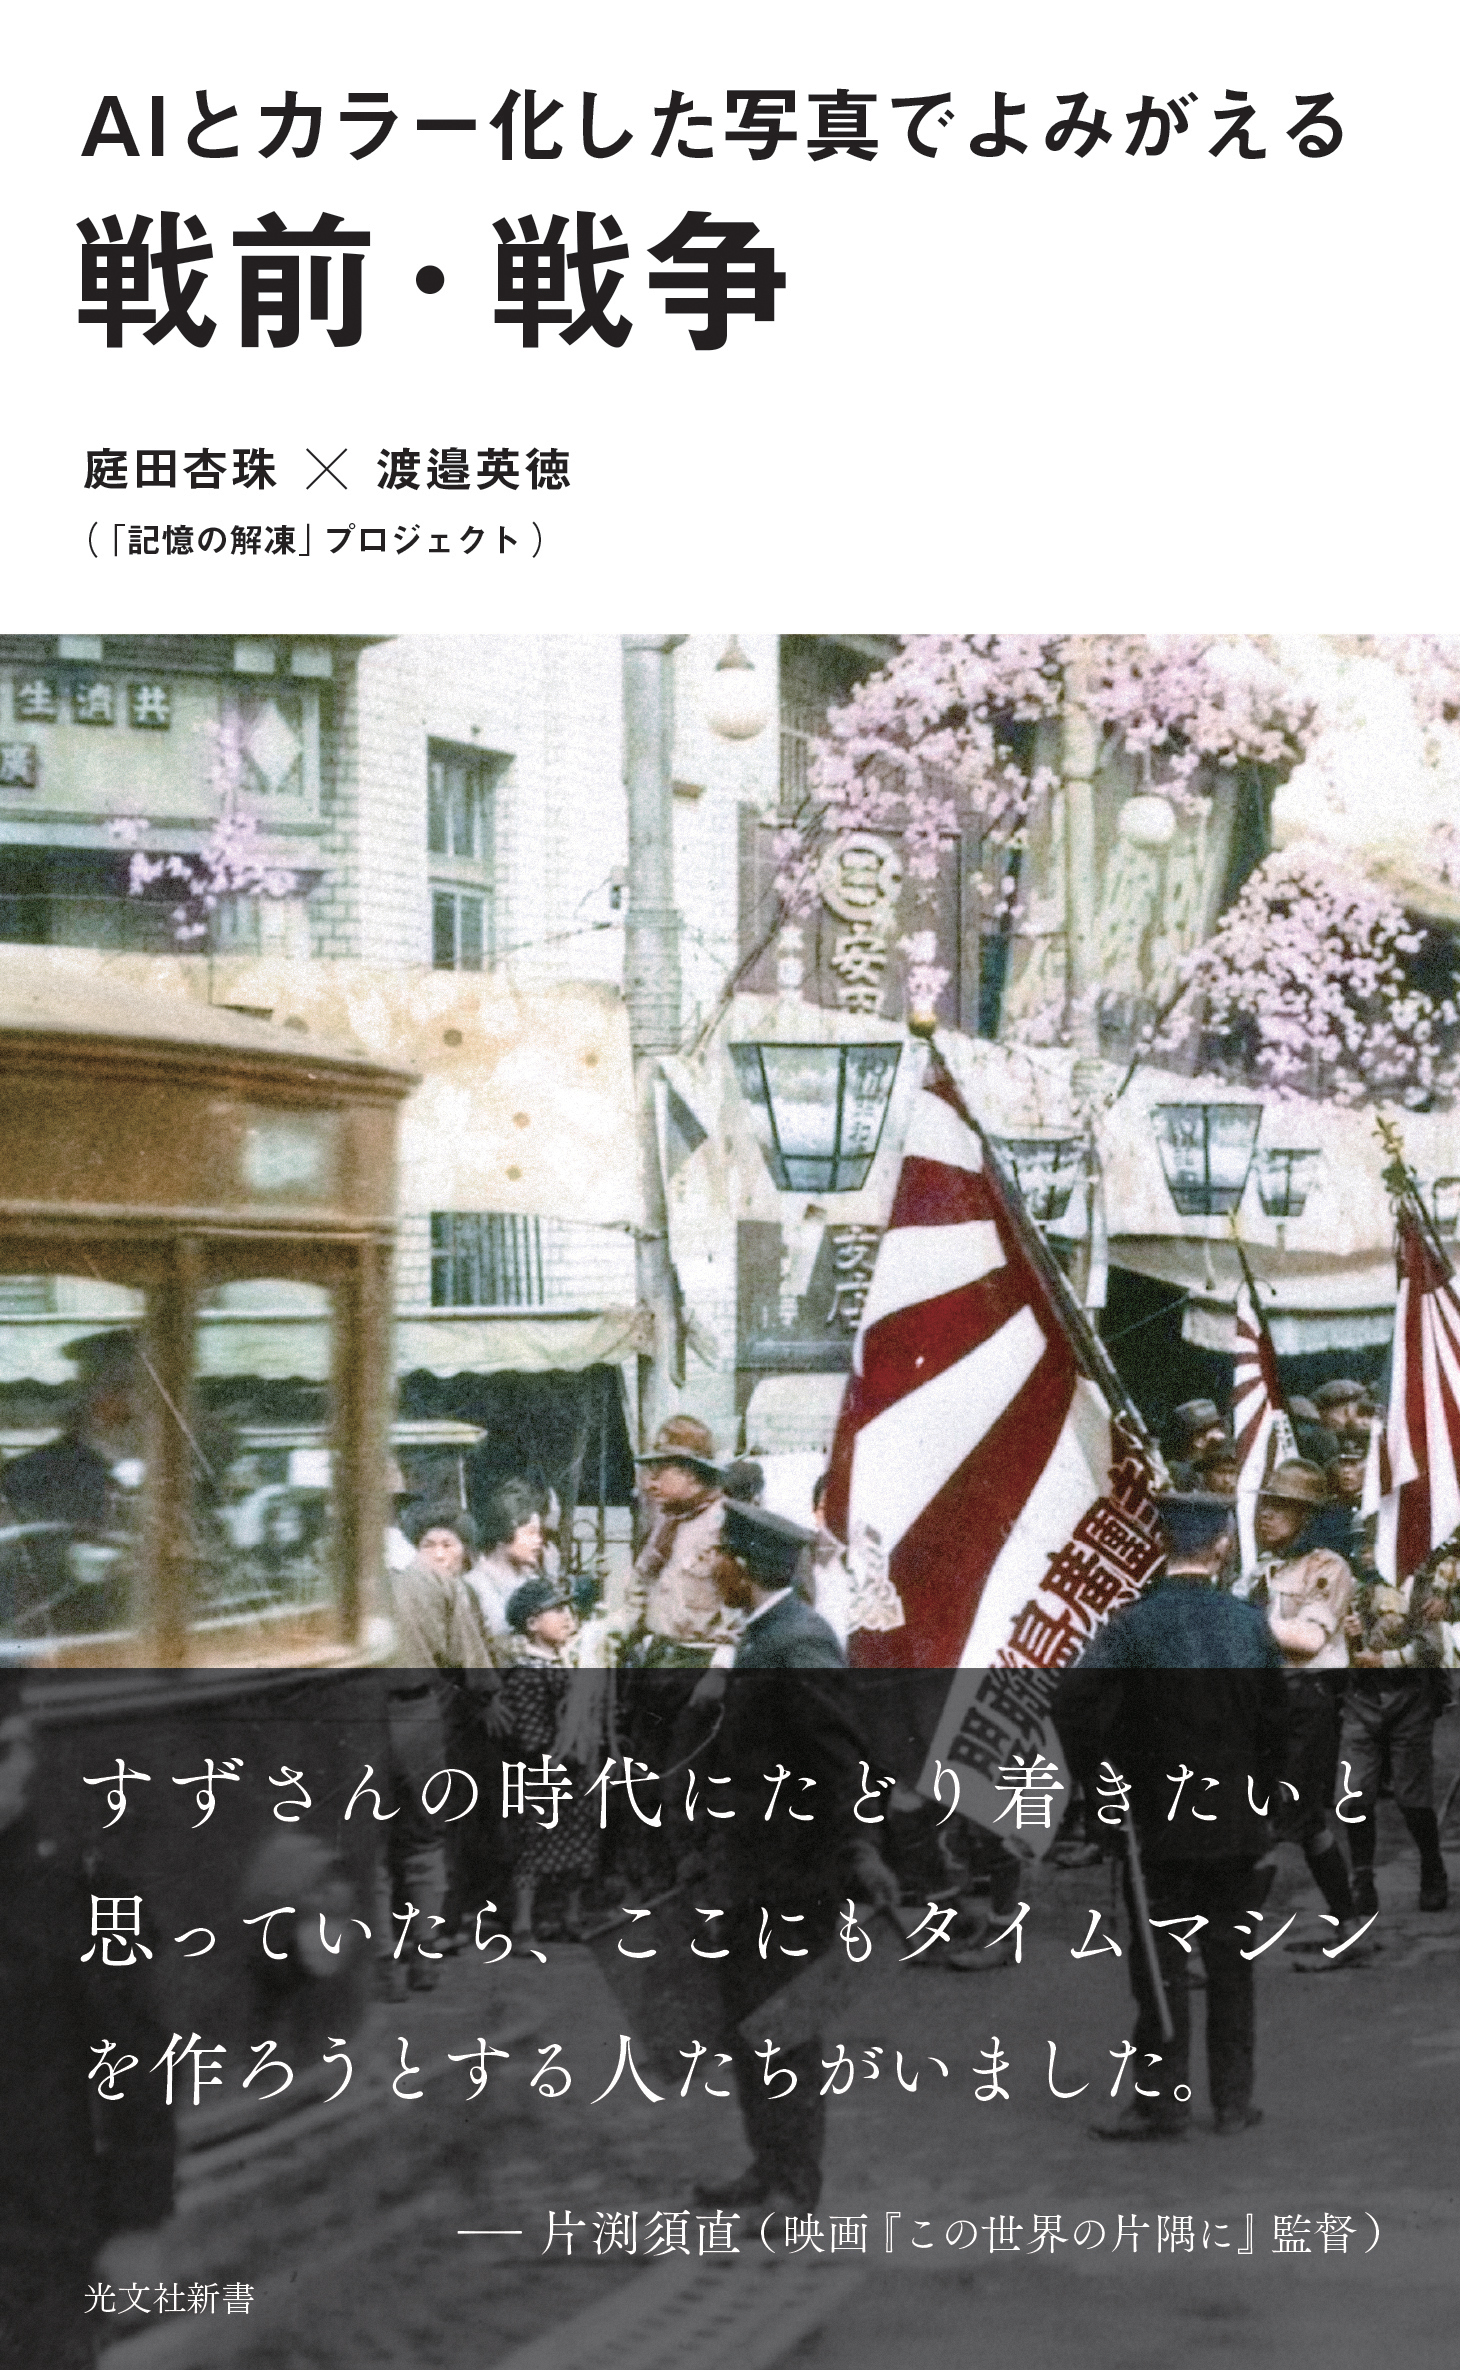
Graduated with a Bachelor of Engineering degree from the Department of Architecture, Faculty of Science and Technology at Tokyo University of Science and received his doctorate in engineering from the Graduate School of Systems and Information Engineering at the University of Tsukuba. Assumed current position in 2018. Creator of Hiroshima Archive, Digital Archives Series on the Great East Japan Earthquake, The Battle of Okinawa Digital Archive, among numerous other digital archives. Author of Deta o Tsumui de Shakai ni Tsunagu (“Spinning Data to Connect to Society”) (Kodansha Gendai Shinsho, 2013) and co-author with Anju Niwata (a UTokyo student) of AI to Color-ka Shita Shashin de Yomigaeru Senzen, Senso (“Rebooting Memories of Prewar & War Through Colorized Photographs in Collaboration with AI and Human”) (Kobunsha, 2020), among other titles.
Date of interview: March 10, 2022